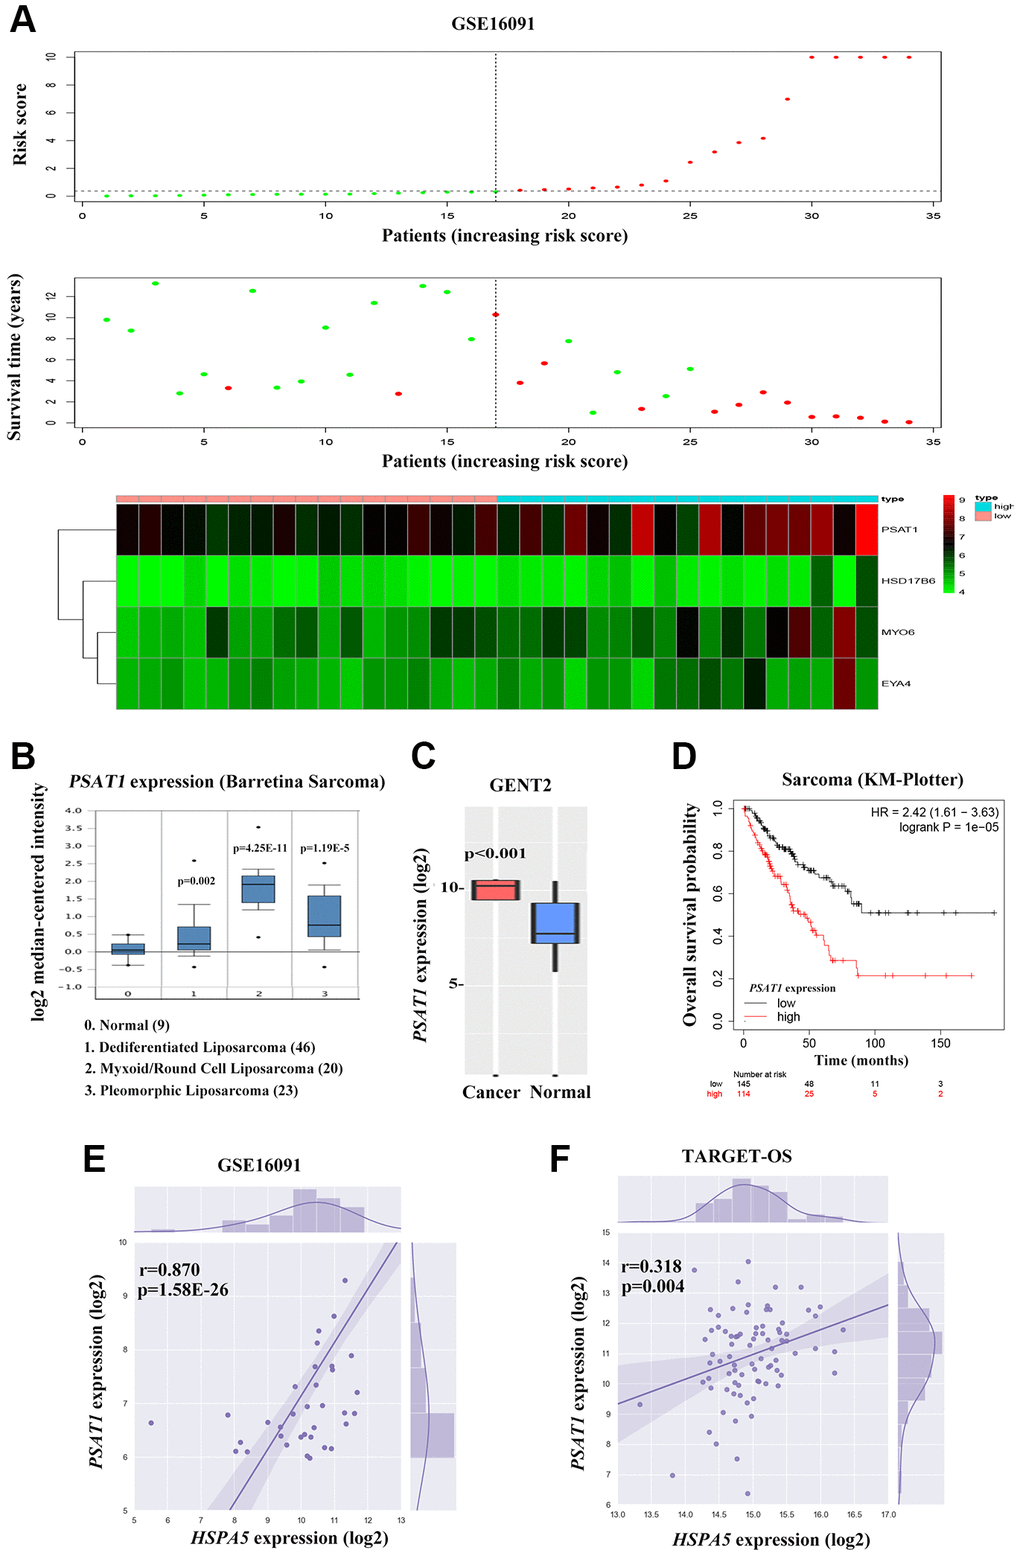
Figure 8.Cross-talk between HSPA5 and the leading OS prognosis-associated predictor PSAT1. (A) The distribution of risk scores is shown for the cohorts from the dataset GSE16091 (upper panel). The alive are shown in green, while the dead are shown in red. And the heatmap of expression profiles of prognostic gene signature. PSAT1 ranks first where high expression indicates poor prognosis of OS patients. (B) Box plot to show differential mRNA level of PSAT1 in sarcoma tumor and normal tissues from ONCOMINE database. (C) PSAT1 expression levels in bone cancer and normal tissues through GENT2 online analysis. (D) Kaplan-Meier curves to show the overall survival of sarcoma patients about PSAT1 gene expression from online KM plotter database. (E, F) The positive correlation between PSAT1 and HSPA5 mRNA expression levels (log2) in GSE16091 and TARGET_OS datasets. Statistical P-value was obtained by Pearson correlation analysis.