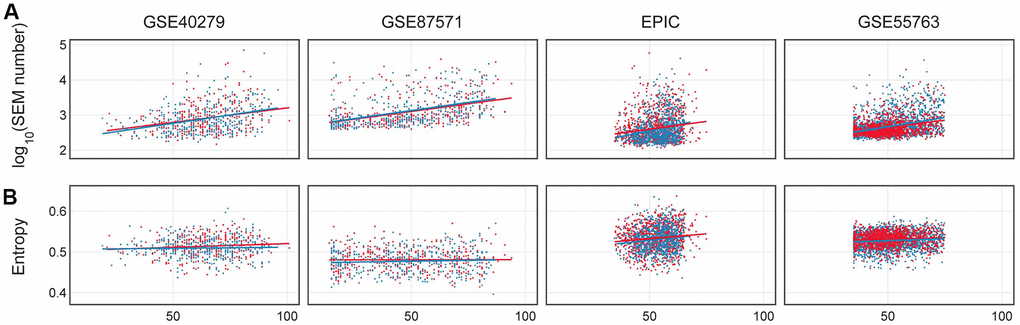
Figure 5.(A) Number of epimutations (log scale) in dependence on age in females (red) and males (blue). (B) Shannon entropy for 4 considered datasets: GSE40279, GSE87571, EPIC, GSE55763.
Figure 5 — Age-related DNA methylation changes are sex-specific: a comprehensive assessment | Aging