Submit an Article
Navigate
Home
Editorial Board
Editorial Policies
Current Volume
Archive
Scientific Integrity
Publication Ethics Statements
Interviews with Outstanding Authors
Newsroom
Sponsored Conferences
Podcast
Contact
Special Collections
Submit an Article
Online ISSN: 1945-4589
Research Paper
|
Volume 12, Issue 23
|
pp. 24057–24080
Age-related DNA methylation changes are sex-specific: a comprehensive assessment
Back to article
Figure 3
(3 of 5)
−
100%
+
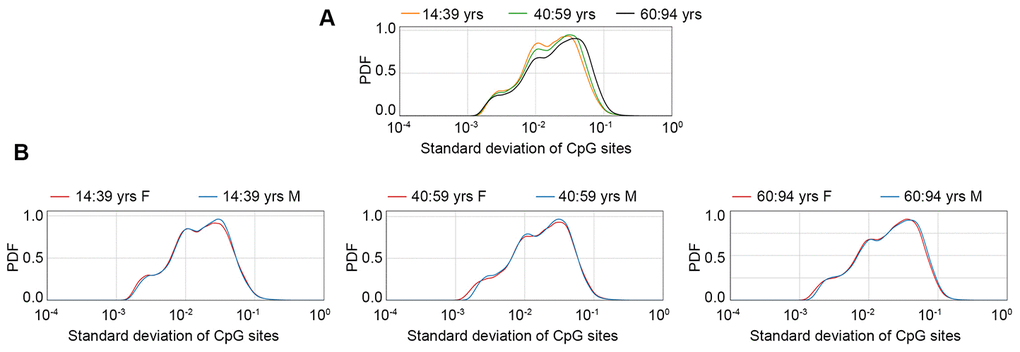
Figure 3.
Probability density function (PDF) of standard deviation values calculated in the GSE87571 dataset for 3 age classes, considering males and females together (
A
) or separated (
B
).