Submit an Article
Navigate
Home
Editorial Board
Editorial Policies
Current Volume
Archive
Scientific Integrity
Publication Ethics Statements
Interviews with Outstanding Authors
Newsroom
Sponsored Conferences
Podcast
Contact
Special Collections
Submit an Article
Online ISSN: 1945-4589
Research Paper
|
Volume 13, Issue 2
|
pp. 2279–2293
The clinicopathological significance and prognostic value of programmed death-ligand 1 in prostate cancer: a meta-analysis of 3133 patients
Back to article
Figure 3
(3 of 4)
−
100%
+
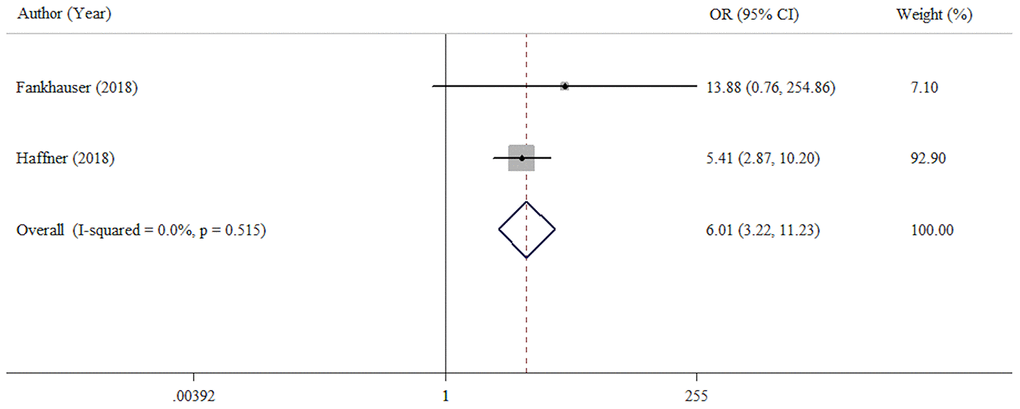
Figure 3.
Forest plot assessing the association between PD-L1 expression and sensitivity of androgen deprivation therapy (CRPC VS HSPC).