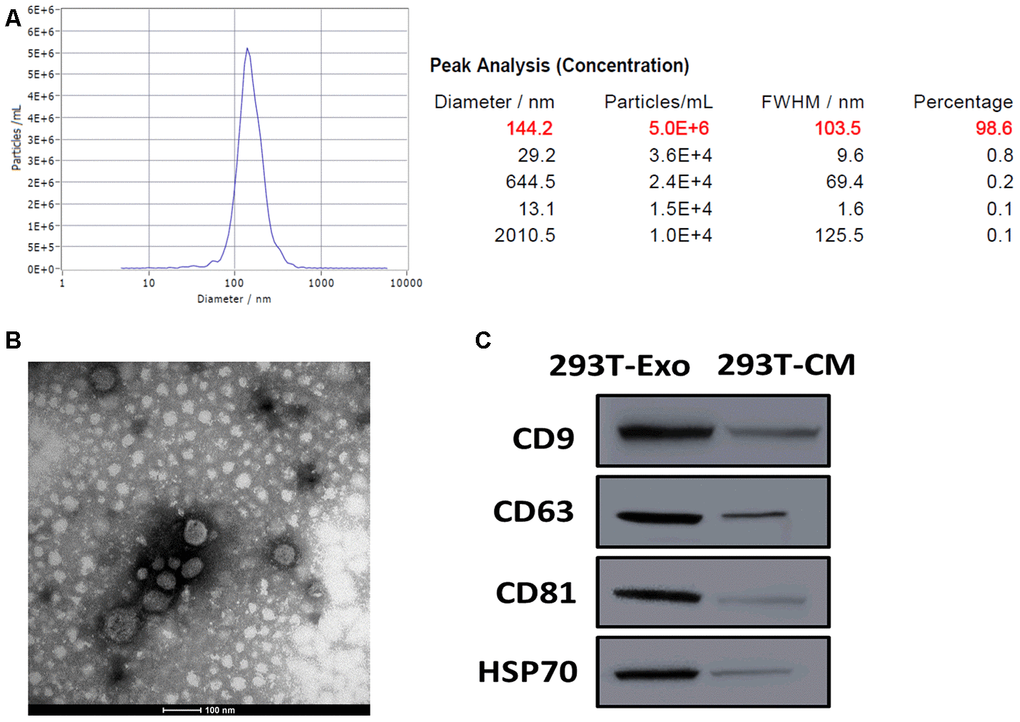
Figure 1.Characterization of 293T-Exo derived from BDNF-expressing 293T cells. (A) Diameter distribution of 293T-Exo determined by nanoparticle tracking analysis (NTA). (B) Representative image of 293T-Exo photographed by transmission electron microscopy (TEM). Scale bard = 100 nm. (C) Protein expressions of exosome surface markers, CD9, CD63, CD81, and HSP70α in 293T-Exo and 293T-Exo-conditioned medium (293T-CM), as measured using western blots.