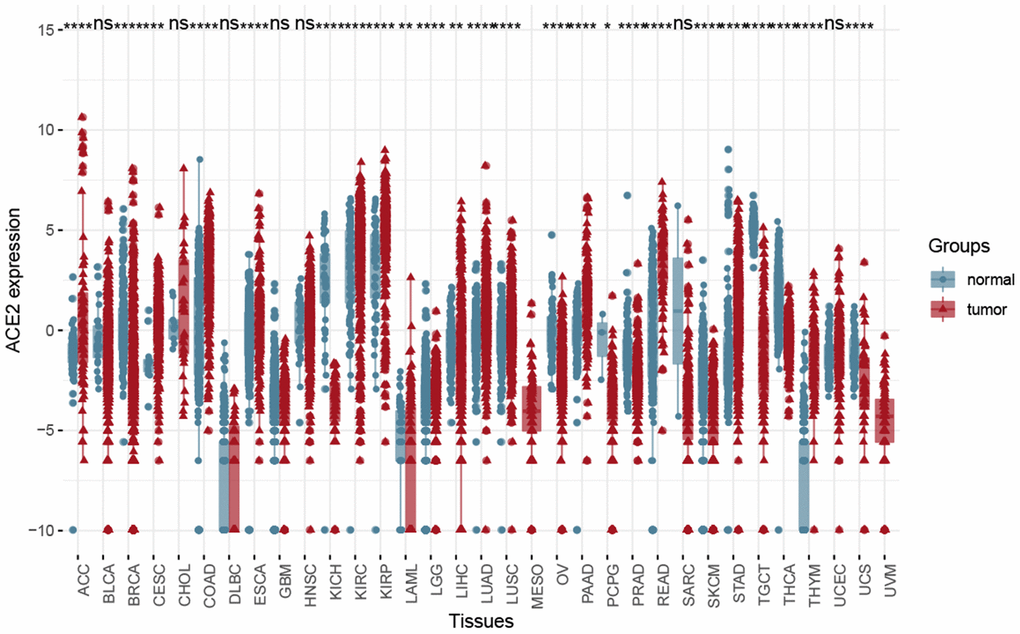
Figure 4.The Box plot showed the difference between solid tumor-normal samples and tumor samples in the Pan-cancer level using Wilcox test. (*P < 0.05, **P < 0.01; ***P < 0.001; ns, P >0.05).
Figure 4 — Expression profiles revealed potential kidney injury caused by SARS-CoV-2: a systematic analysis of ACE2 and clinical lessons learned from this discovery | Aging