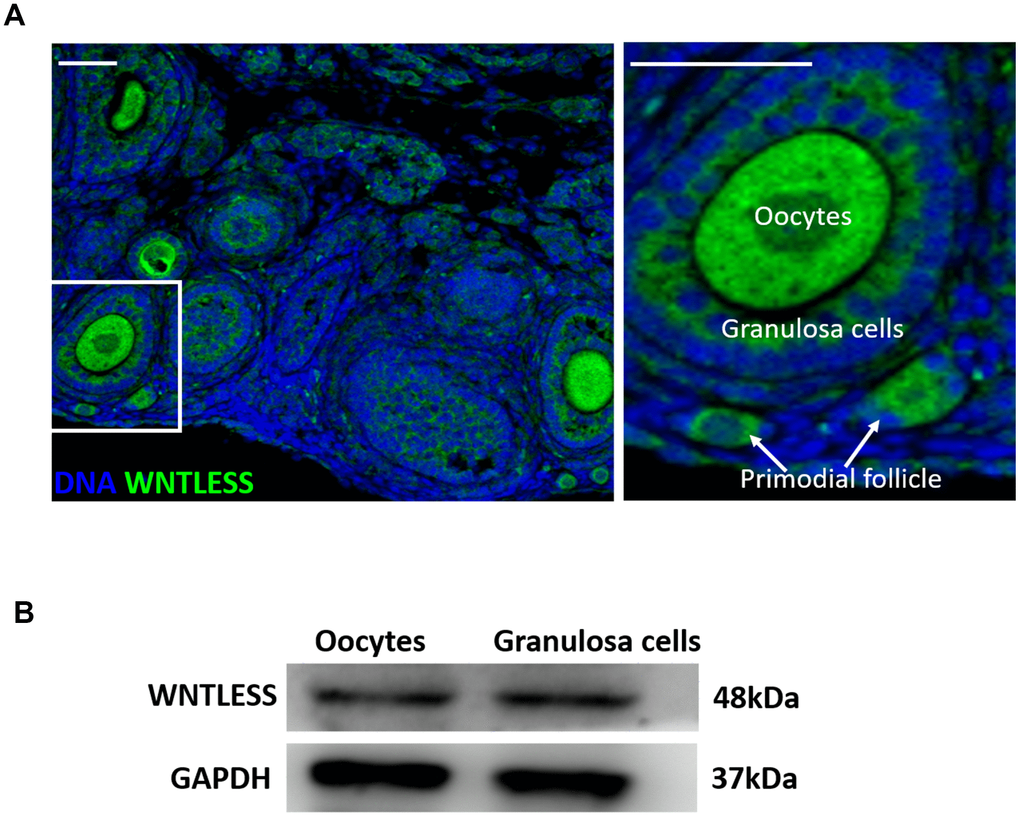
Figure 1.WNTLESS expression in the ovary. (A) The immunofluorescent staining of WNTLESS in the normal ovary. Green, WNTLESS; Blue, DNA. Scale bar, 100 μm. (B) The levels of WNTLESS protein in oocytes and granulosa cells are displayed by the western blot method. 200 oocytes and 106 granulosa cells were used.