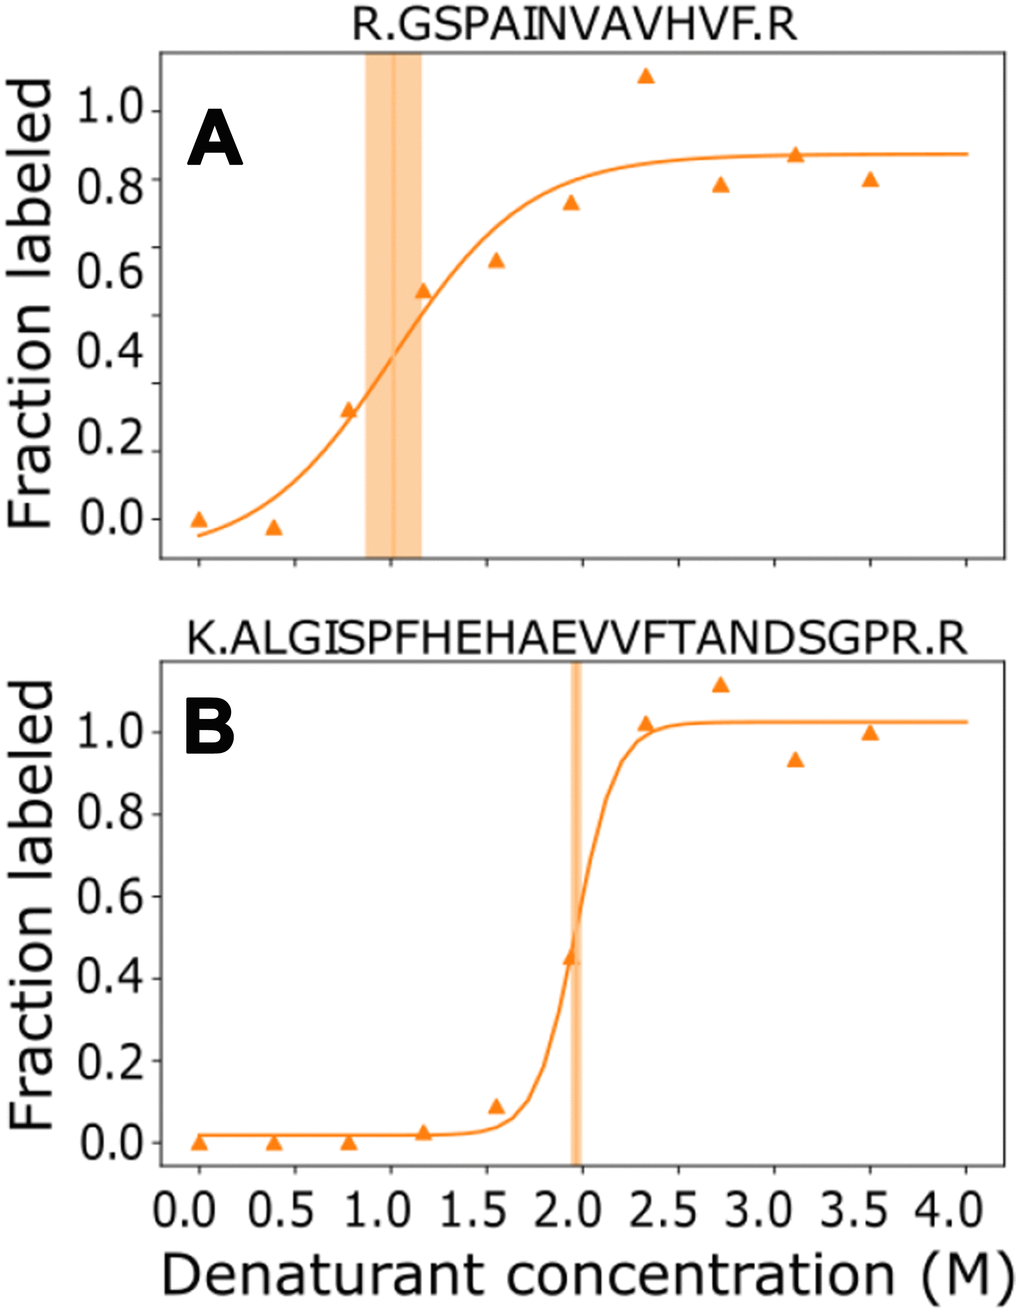
Figure 5.TTR structure causes modified susceptibility to denaturation for different parts of the sequence. Individual measurements (triangles) were fit across the denaturant concentrations to calculate the midpoint (vertical line) and confidence interval of the midpoint (shaded area) for two representative peptides (Panel A: amino acids 43-55, Panel B: amino acids 101-123).