Submit an Article
Navigate
Home
Editorial Board
Editorial Policies
Current Volume
Archive
Scientific Integrity
Publication Ethics Statements
Interviews with Outstanding Authors
Newsroom
Sponsored Conferences
Podcast
Contact
Special Collections
Submit an Article
Online ISSN: 1945-4589
Theory Article
|
Volume 12, Issue 22
|
pp. 22356–22369
Proposing a minimal set of metrics and methods to predict probabilities of amyloidosis disease and onset age in individuals
Back to article
Figure 2
(2 of 6)
−
100%
+
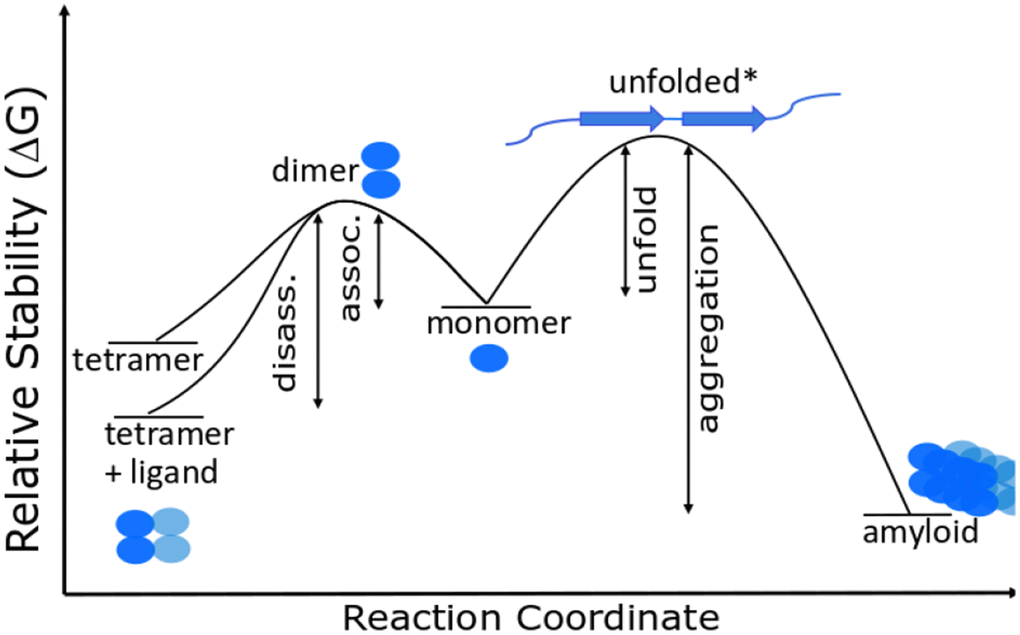
Figure 2.
Gibbs energy diagram for dissociation/association reactions of TTR.