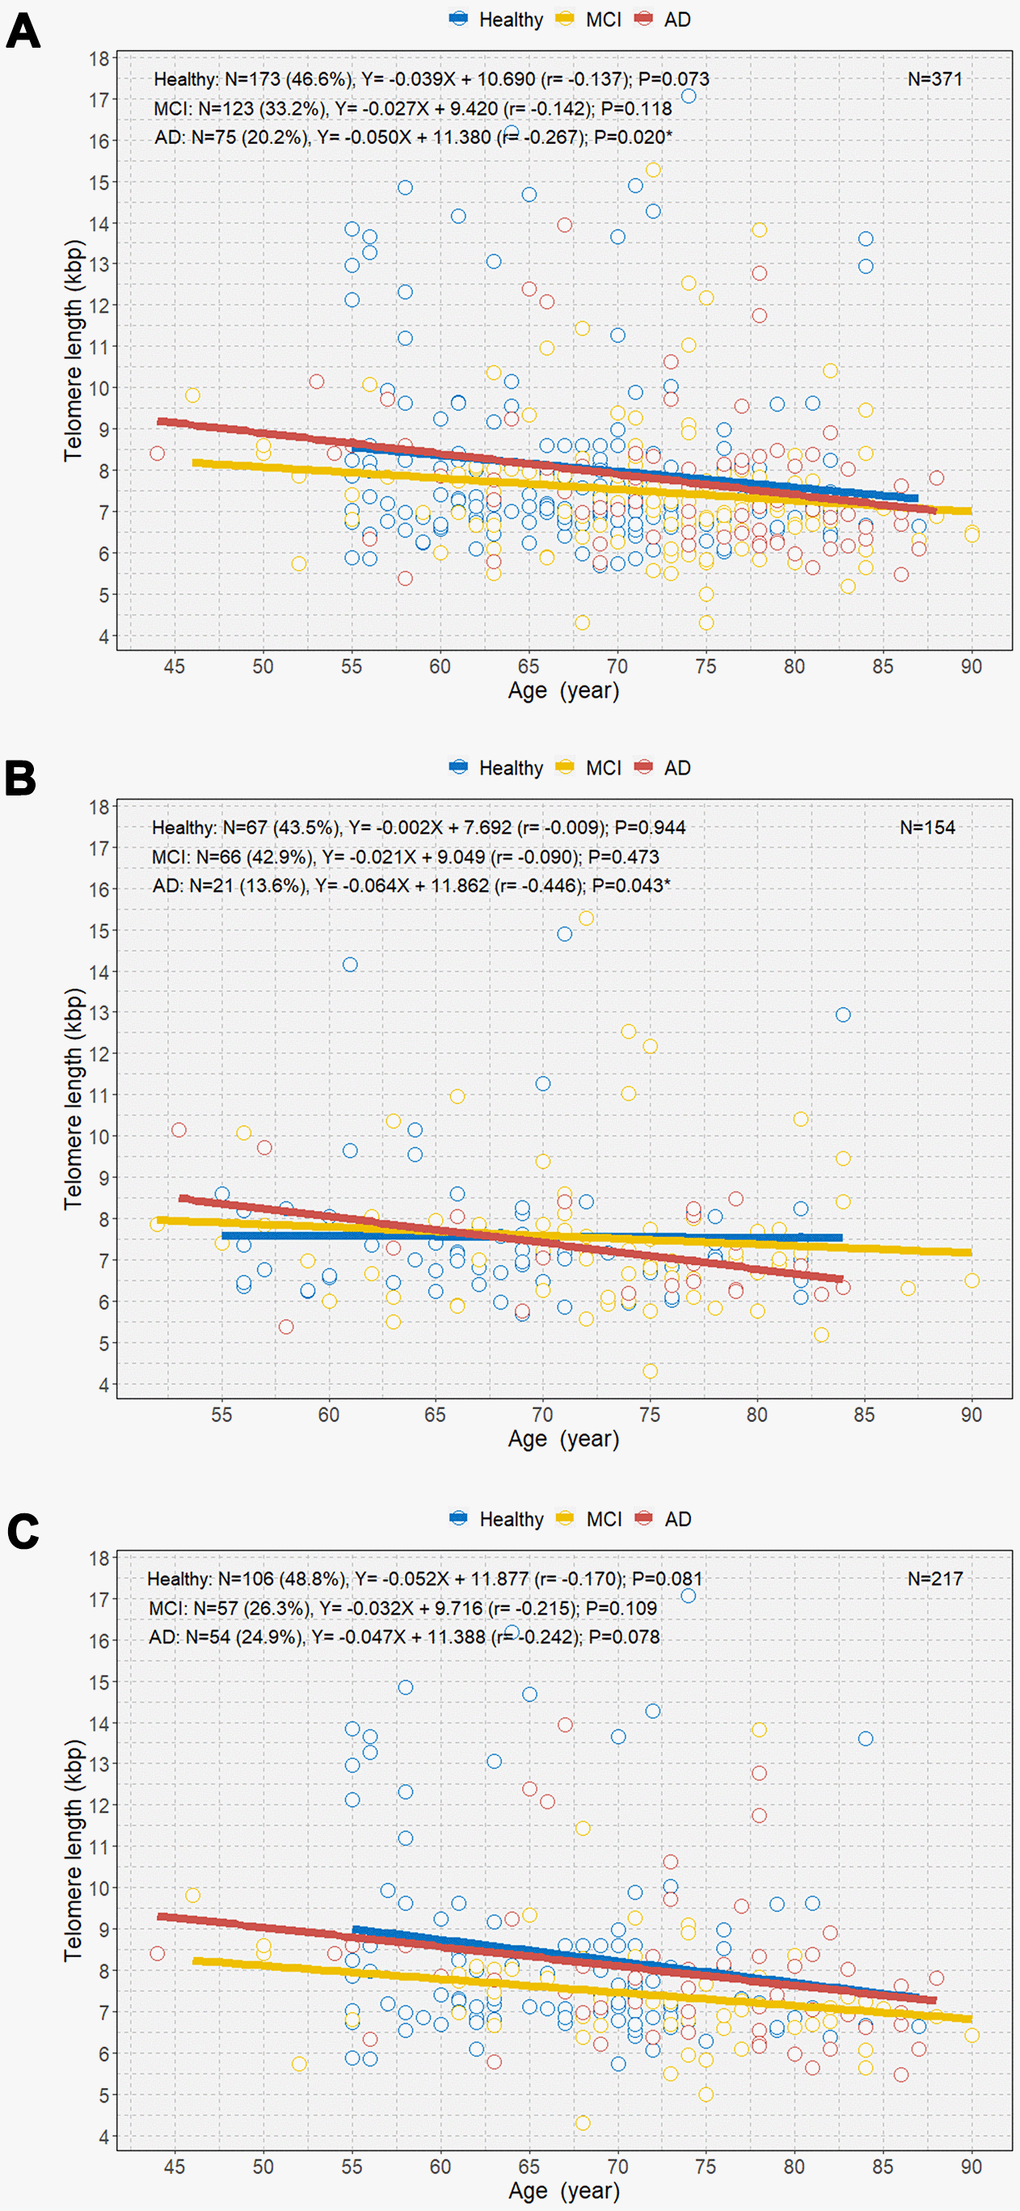
Figure 4.Scatterplot with linear regression line showing the associations between age and telomere length among healthy individuals and individuals with MCI and AD (A), age and telomere length among the three groups in men (B), and age and telomere length among the three groups in women (C). MCI=mild cognitive impairment; AD=Alzheimer’s disease. *P<0.05.