Submit an Article
Navigate
Home
Editorial Board
Editorial Policies
Current Volume
Archive
Scientific Integrity
Publication Ethics Statements
Interviews with Outstanding Authors
Newsroom
Sponsored Conferences
Podcast
Contact
Special Collections
Submit an Article
Online ISSN: 1945-4589
Research Paper
|
Volume 13, Issue 2
|
pp. 2089–2100
Relationship between telomere shortening and age in Korean individuals with mild cognitive impairment and Alzheimer’s disease compared to that in healthy controls
Back to article
Figure 2
(2 of 4)
−
100%
+
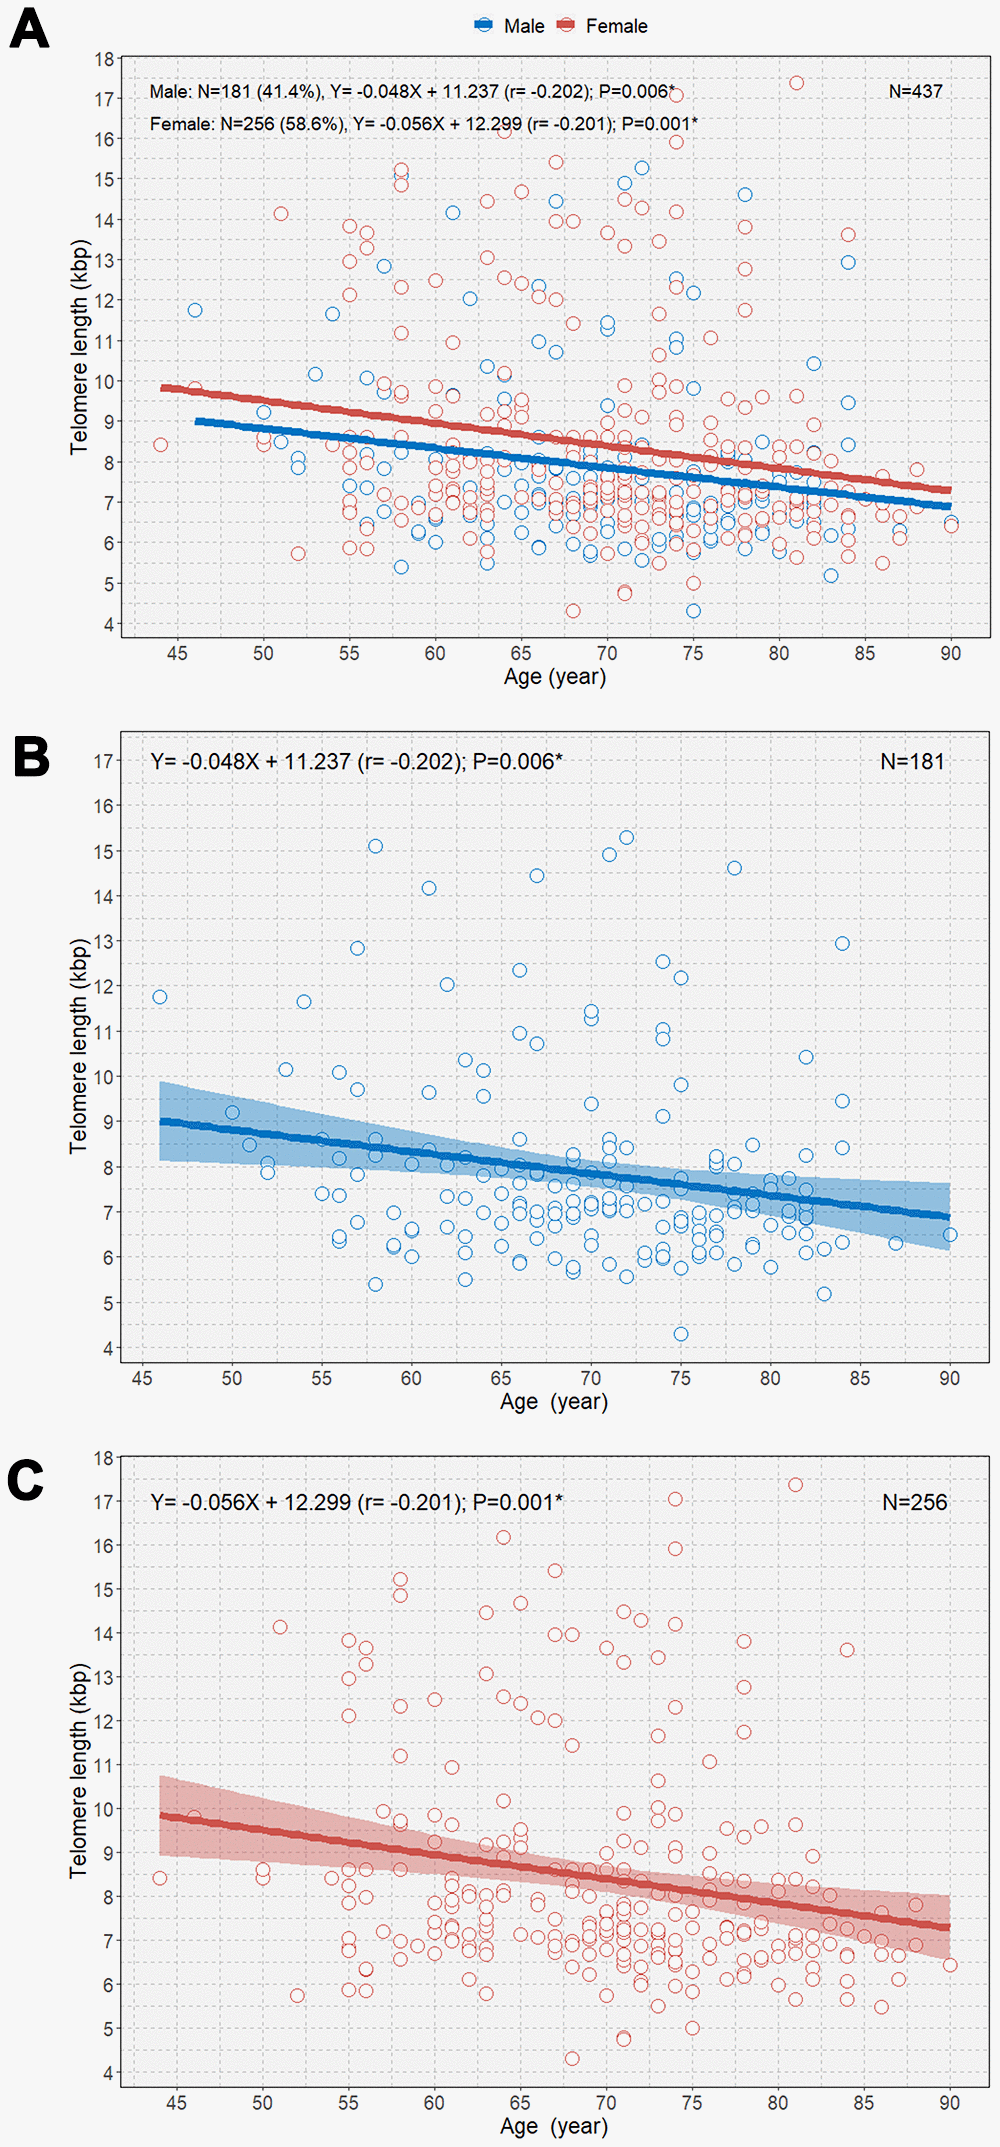
Figure 2.
Scatterplot with linear regression lines with 95% confidence intervals showing the associations between age and telomere length according to sex (
A
), age and telomere length in men (
B
); and age and telomere length in women (
C
). *P<0.05.