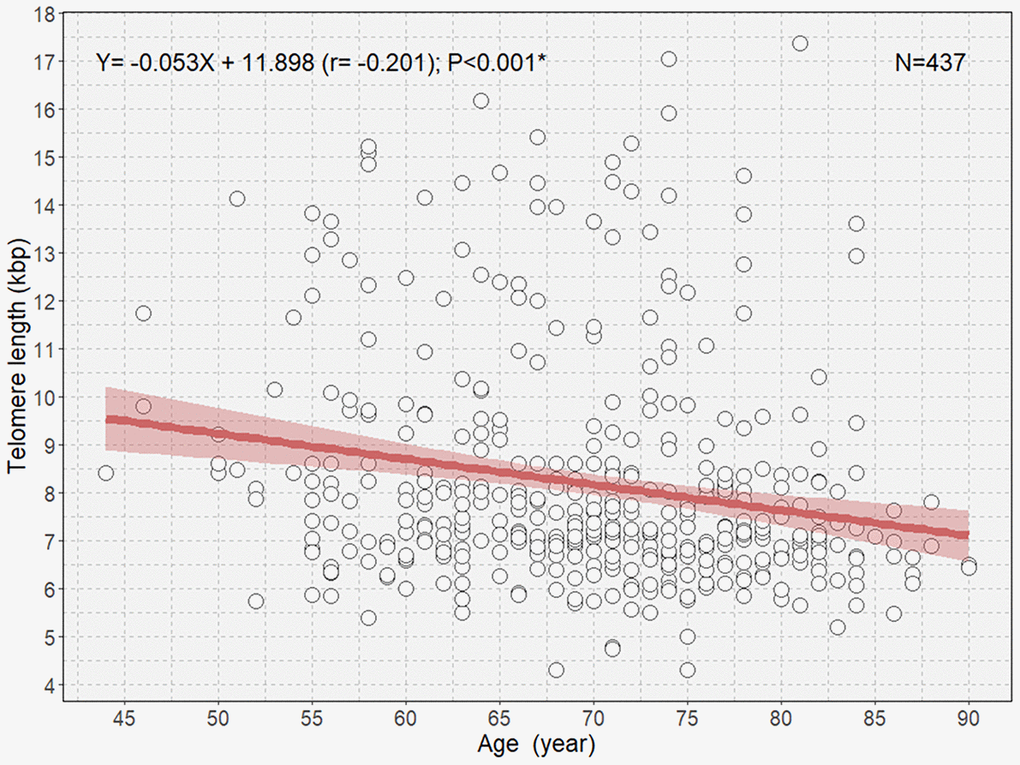
Figure 1.Scatterplot with a linear regression line and 95% confidence interval showing the association between age and telomere length in all participants. *P<0.05.
Figure 1 — Relationship between telomere shortening and age in Korean individuals with mild cognitive impairment and Alzheimer’s disease compared to that in healthy controls | Aging