Submit an Article
Navigate
Home
Editorial Board
Editorial Policies
Current Volume
Archive
Scientific Integrity
Publication Ethics Statements
Interviews with Outstanding Authors
Newsroom
Sponsored Conferences
Podcast
Contact
Special Collections
Submit an Article
Online ISSN: 1945-4589
Research Paper
|
Volume 13, Issue 2
|
pp. 2049–2072
Tumor-associated macrophage polarization promotes the progression of esophageal carcinoma
Back to article
Figure 1
(1 of 10)
−
100%
+
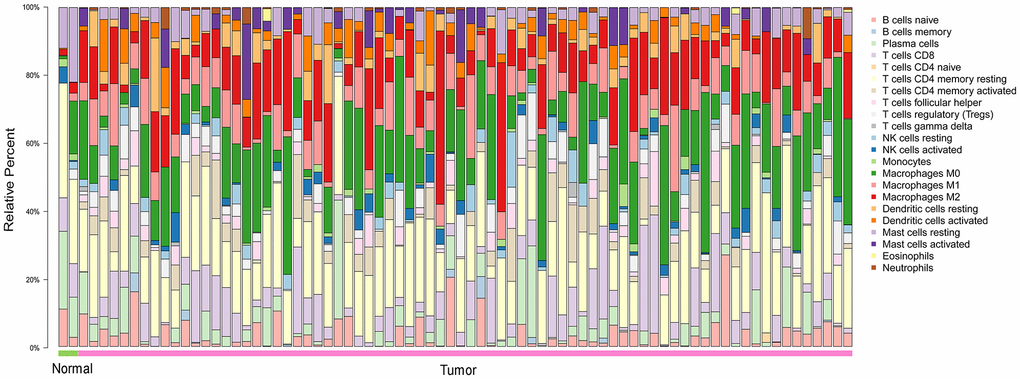
Figure 1.
The landscape of 22 TIICs in ESCA, and their proportions in each sample as quantified using CIBERSORT.
Normal = 2 samples; tumor = 76 samples. M0, green; M1, pink; M2, red.