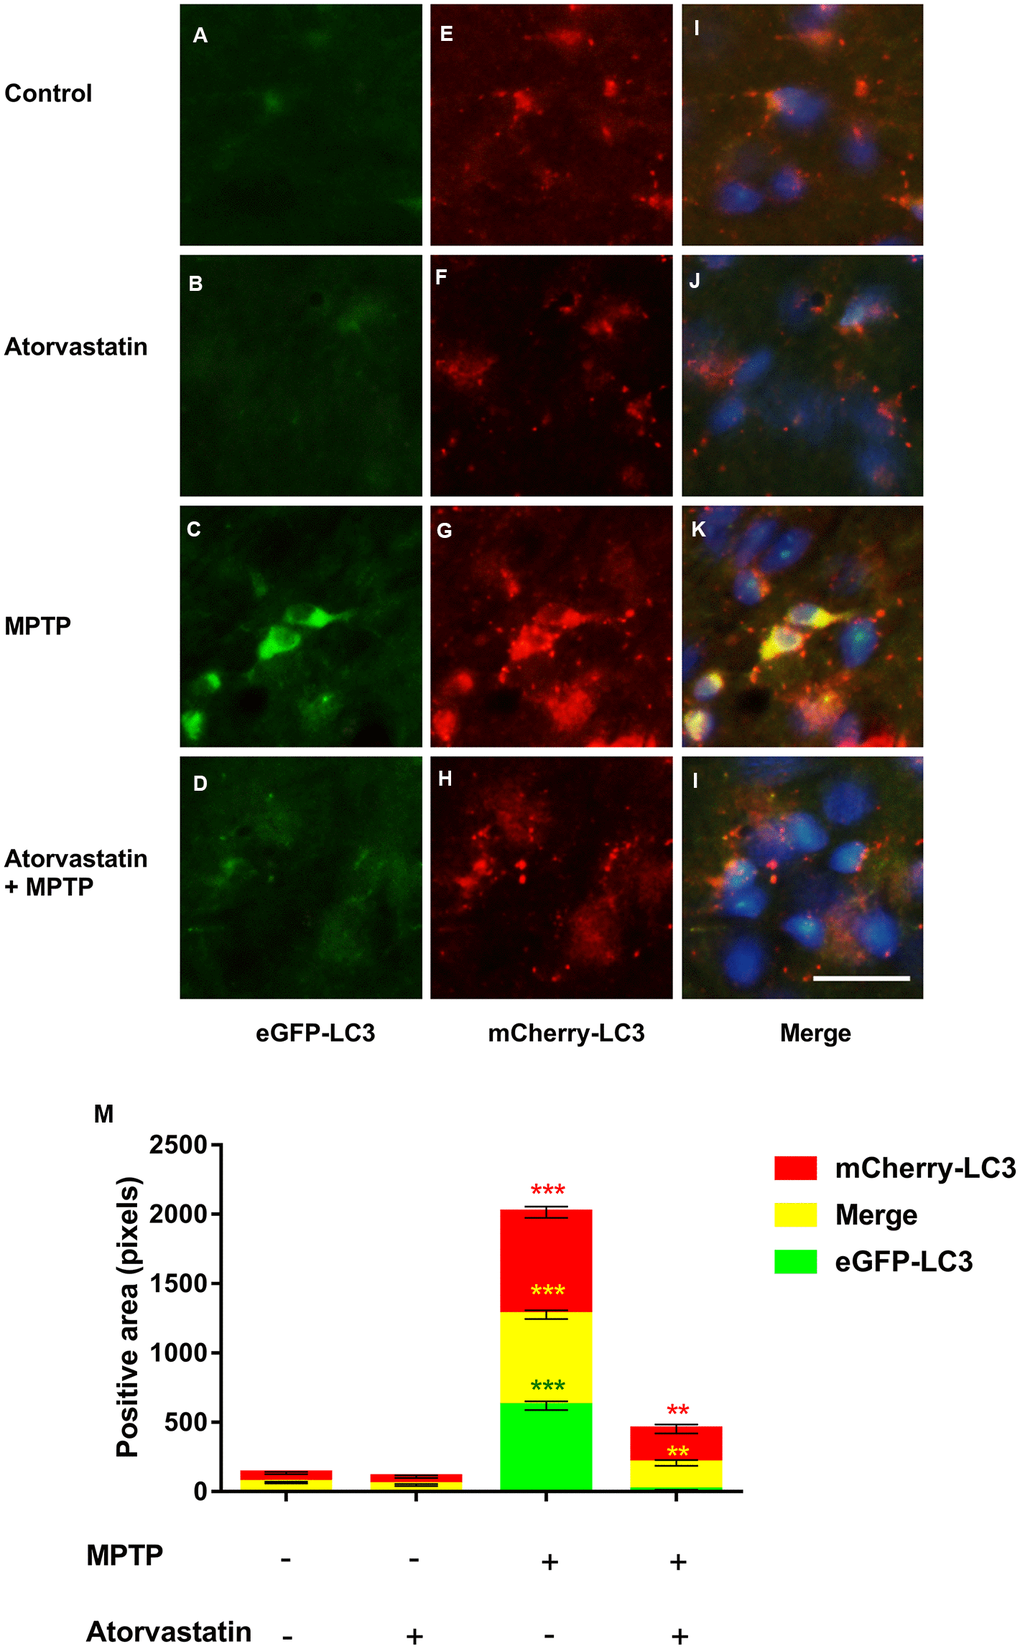
Figure 3.Changes in autophagic flux in MPTP mice. The expression of eGFP-LC3 in substantia nigra neurons of autophagic flux marker mouse models(A–D). The expression of mCherry-LC3 in substantia nigra neurons of autophagic flux marker mouse models(E–H). The merged figures show the expression of eGFP-mCherry-LC3 (I–L). Bar = 20 μm. Quantitative analysis of eGFP, mCherry and merged positive area (M). The results are expressed as ***p < 0.001 compared to atorvastatin/MPTP (-/-). The results were expressed as **p < 0.01 compared to atorvastatin/MPTP (-/+).