Submit an Article
Navigate
Home
Editorial Board
Editorial Policies
Current Volume
Archive
Scientific Integrity
Publication Ethics Statements
Interviews with Outstanding Authors
Newsroom
Sponsored Conferences
Podcast
Contact
Special Collections
Submit an Article
Online ISSN: 1945-4589
Research Paper
|
Volume 12, Issue 22
|
pp. 22445–22456
Hyperbaric oxygen therapy increases telomere length and decreases immunosenescence in isolated blood cells: a prospective trial
Back to article
Figure 4
(4 of 4)
−
100%
+
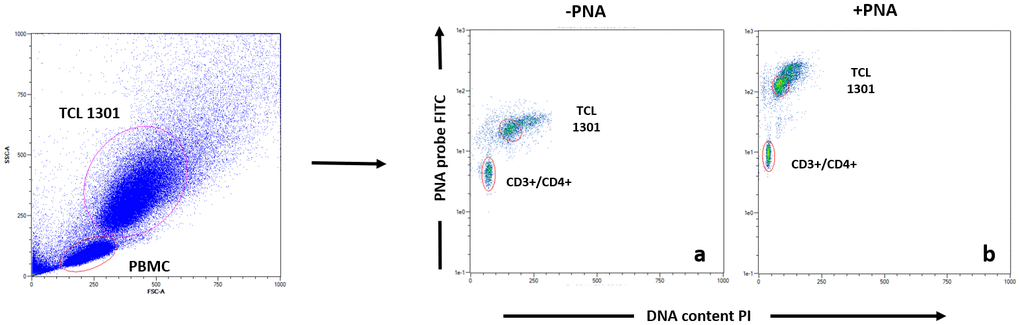
Figure 4.
Example of Flow Fish data analysis of T helper subpopulation.
Each blood sample was either stained with PNA probe (
b
) or without (
a
), following by antibodies staining (CD3, CD4, CD8, CD16, CD19), before data acquisition.