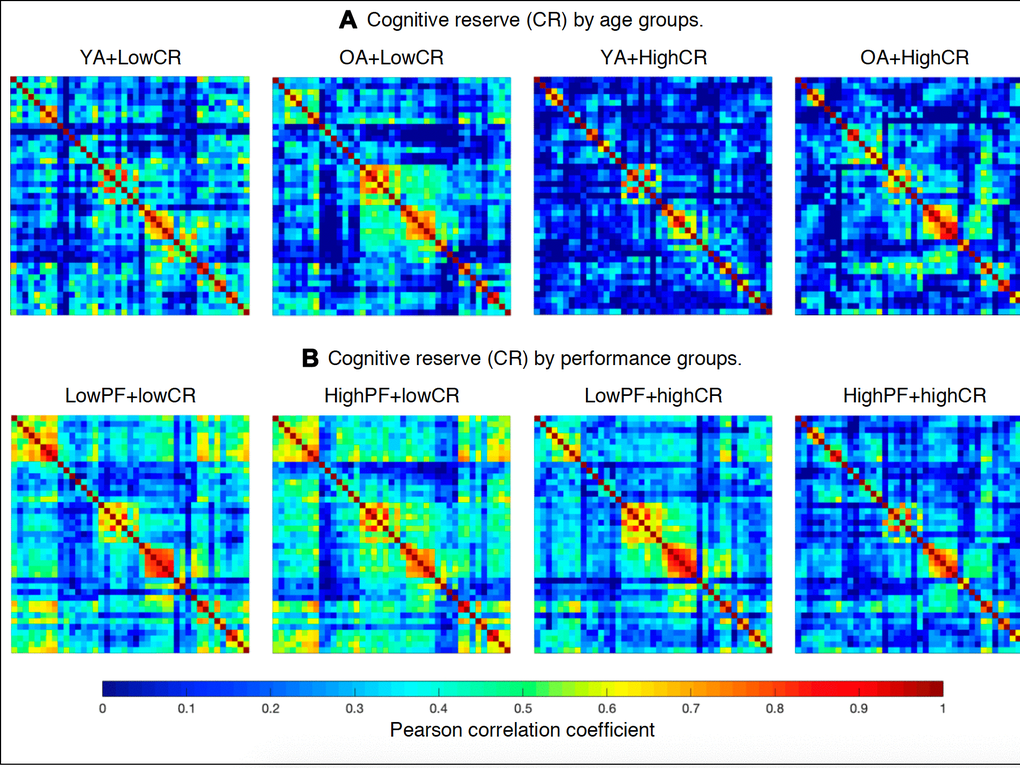
Figure 6.Weighted correlation matrices (See Supplementary Figures 1–8 for matrices with larger size and labeled regions). (A) Cognitive reserve by age groups: YA+LowCR, younger age group with low CR; OA+LowCR, older age group with low CR; YA+HighCR, younger age group with high CR; OA+HighCR, older age group with high CR. (B) Cognitive reserve by performance groups: LowPF+lowCR, low performance group with low CR; HighPF+lowCR, high performance group with low CR; LowPF+highCR, low performance group with high CR; HighPF+highCR, high performance group with high CR. Rows and columns correspond to the correlations between cognitive measures. The color bar indicates the strength of the Pearson correlation coefficients: colder colors represent weaker correlations, while warmer colors represent stronger correlations.