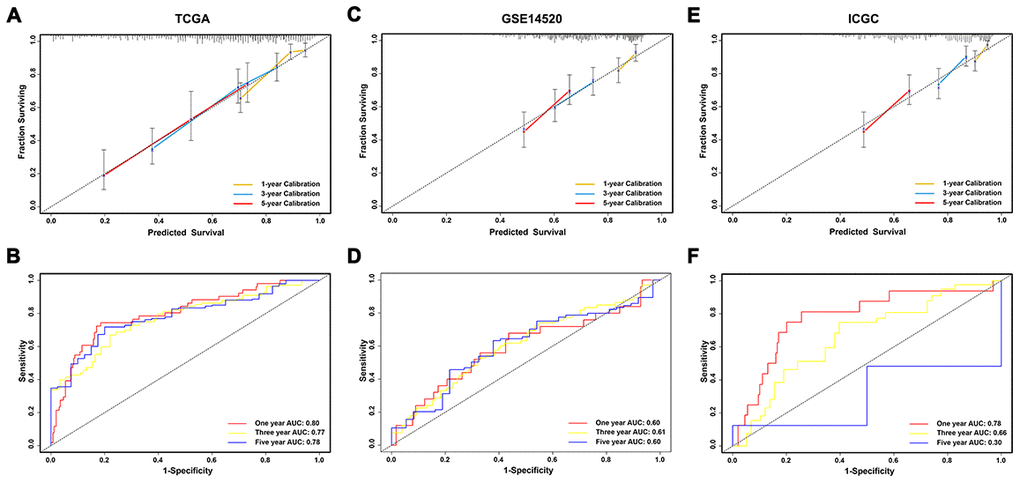
Figure 5.Evaluation and validation of the prediction value of immunoscore in three independent cohorts. (A, C, E) Calibration plot of the immunoscore for predicting the probability of survival at 1-, 3-, and 5-years in TCGA, GSE14520, and ICGC datasets, respectively; (B, D, F) Time-dependent ROC curve of immunoscore for 1-, 3-, and 5-year overall survival predictions in TCGA, GSE14520, and ICGC datasets, respectively.