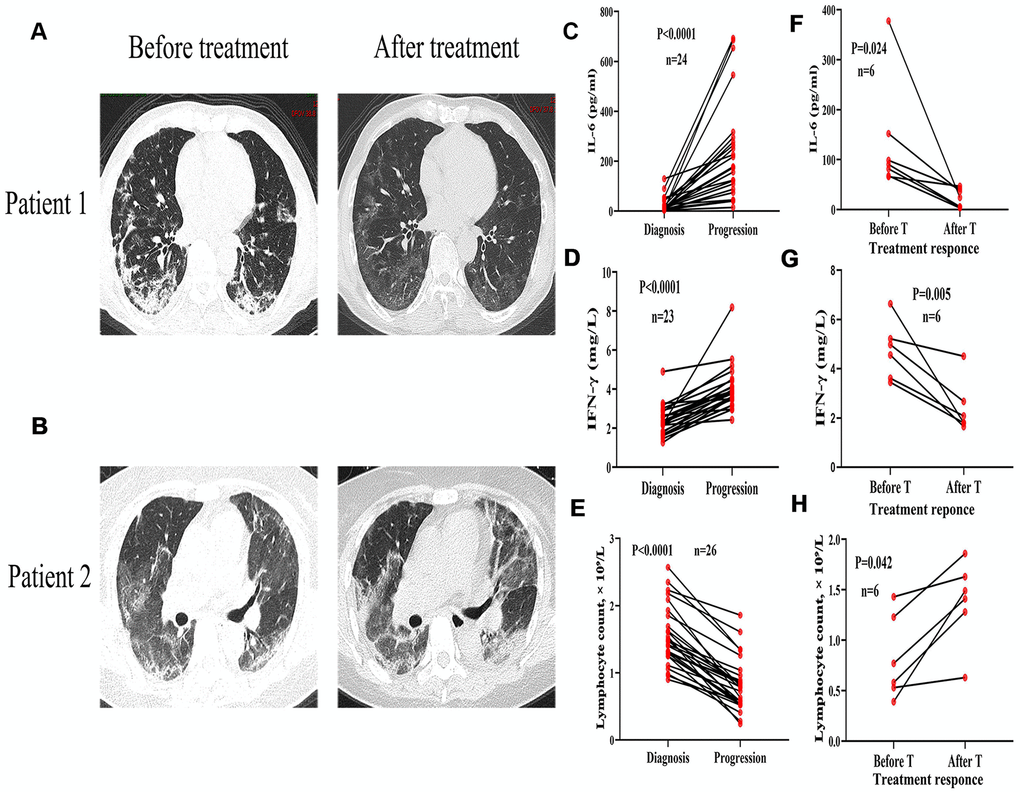
Figure 4.Variation of chest CT images, inflammatory cytokines, and lymphocyte count in severe COVID-19 patients with and without comorbidities. CT images from a 70-year-old male with diabetes showing bilateral lungs before treatment and infiltrating inflammation after one week of treatment. (B) CT images from a 72-year-old female with diabetes and hypertension showing infiltrating inflammation in bilateral lungs before treatment and deteriorated lung inflammation after one week of treatment. (C–E) Serum levels of IL-6 and IFN-γ progressively increased and lymphocytes decreased with disease progression. (F–H) Decreased serum levels of IL-6 and IFN-γ, and recovered lymphocytes before and after glucocorticoid treatment (T).