Submit an Article
Navigate
Home
Editorial Board
Editorial Policies
Current Volume
Archive
Scientific Integrity
Publication Ethics Statements
Interviews with Outstanding Authors
Newsroom
Sponsored Conferences
Podcast
Contact
Special Collections
Submit an Article
Online ISSN: 1945-4589
Research Paper
|
Volume 13, Issue 2
|
pp. 1972–1988
Plasma cytokines for predicting diabetic retinopathy among type 2 diabetic patients via machine learning algorithms
Back to article
Figure 3
(3 of 3)
−
100%
+
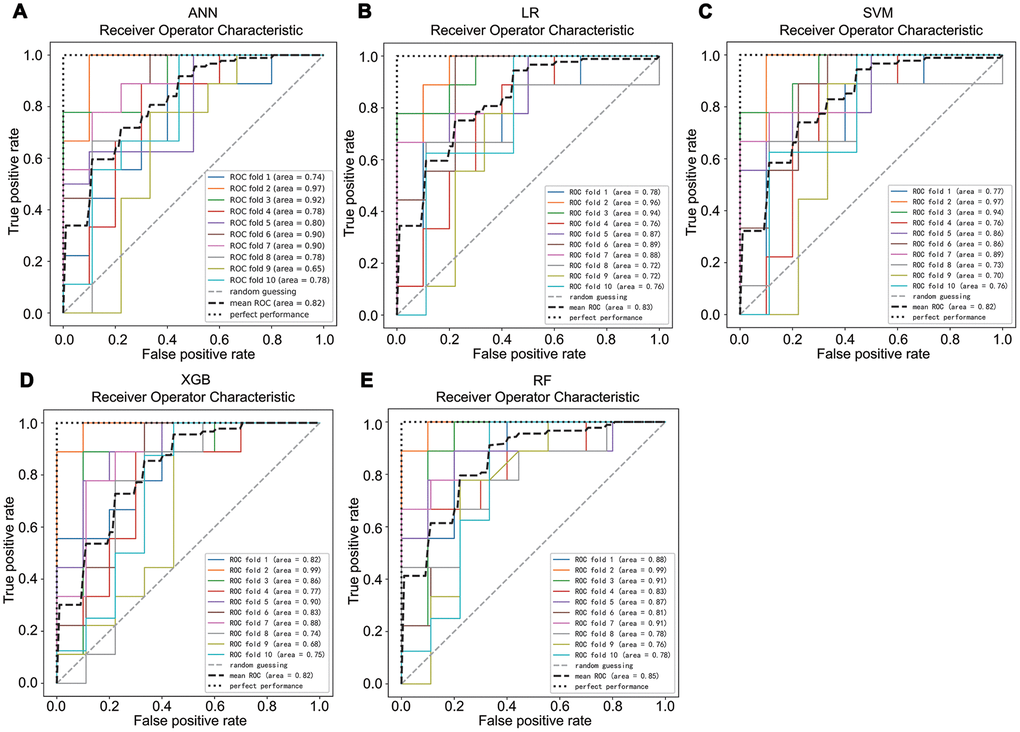
Figure 3.
The average area under the curve of a 10-fold cross validation of ANN (
A
), LR (
B
), SVM (
C
), XBG (
D
), and RF (
E
) in the train set.
Figure 3 — Plasma cytokines for predicting diabetic retinopathy among type 2 diabetic patients via machine learning algorithms | Aging