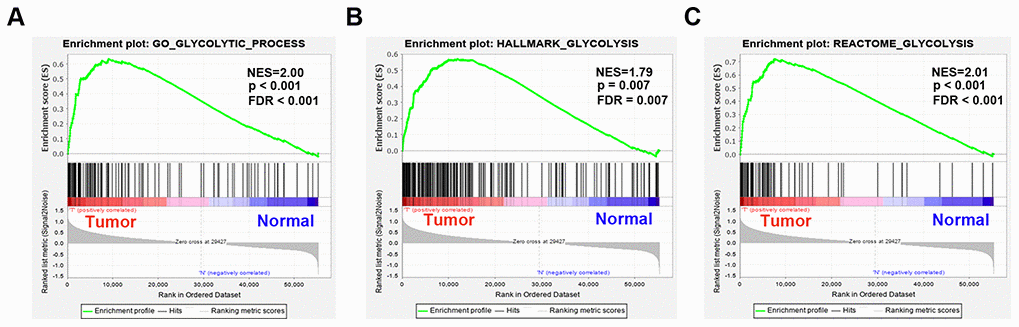
Figure 1.Enrichment plots between EAC and normal tissues identified by GSEA. (A) GO glycolytic process gene set, (B) Hallmark glycolysis gene set, (C) Reactome glycolysis gene set. Abbreviations: FDR, False discovery rate; NES, Normalized enrichment score;