Submit an Article
Navigate
Home
Editorial Board
Editorial Policies
Current Volume
Archive
Scientific Integrity
Publication Ethics Statements
Interviews with Outstanding Authors
Newsroom
Sponsored Conferences
Podcast
Contact
Special Collections
Submit an Article
Online ISSN: 1945-4589
Research Paper
|
Volume 12, Issue 22
|
pp. 22457–22494
Generalized correlation coefficient for genome-wide association analysis of cognitive ability in twins
Back to article
Figure 2
(2 of 5)
−
100%
+
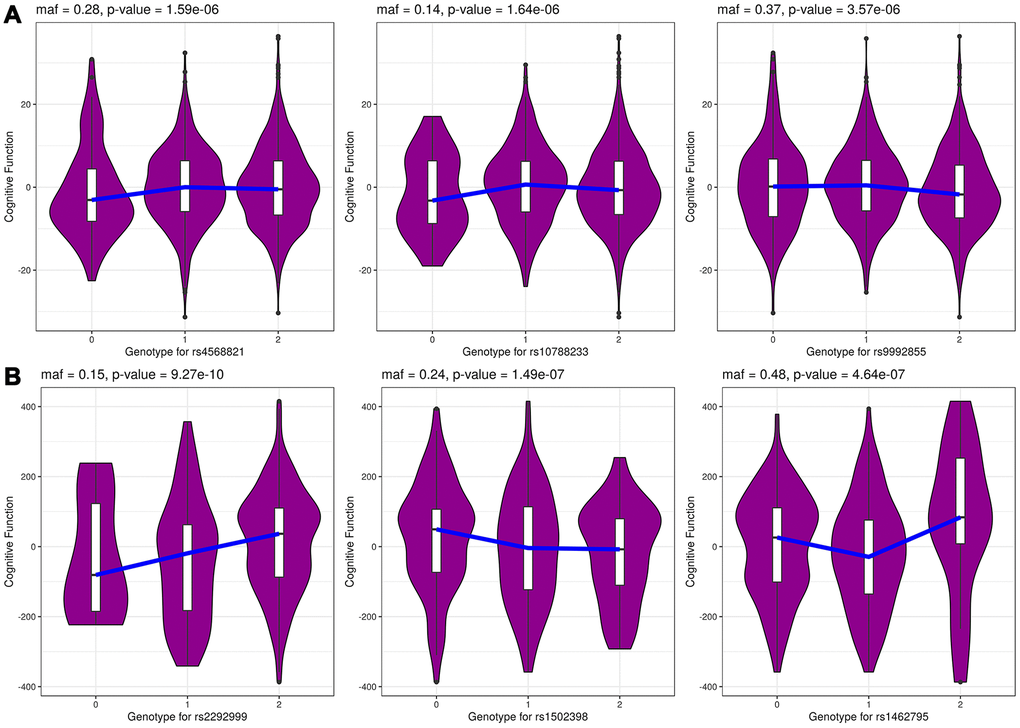
Figure 2.
The genotype-specific density distribution for top 3 genotyped SNPs in Danish (
A
) and Chinese (
B
) samples from GCC model. The x-axis shows the SNP genotypes 0, 1 and 2 and y-axis shows cognitive function phenotype.