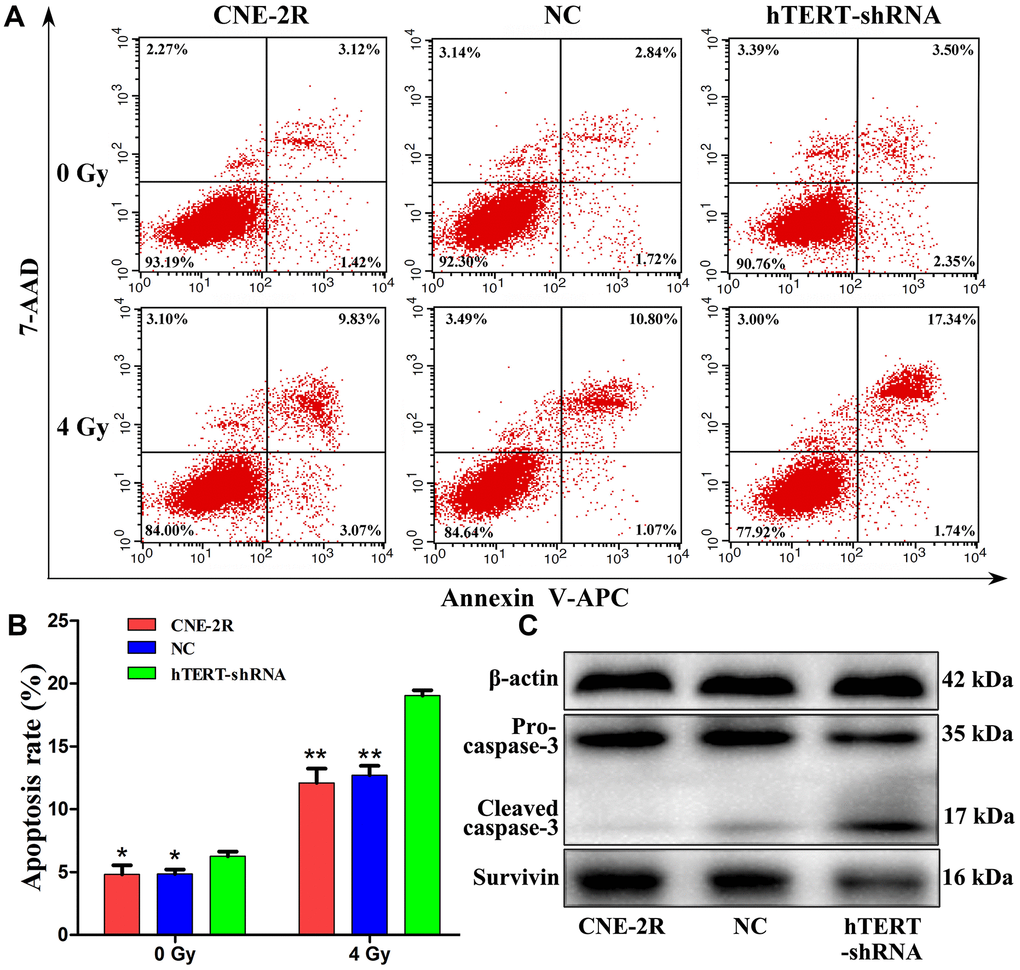
Figure 3.hTERT silencing promoted apoptosis. (A) The apoptosis rates after irradiation at 0 Gy and 4 Gy; (B) Histogram of the apoptosis rate in each group (* indicates P<0.05 compared with hTERT-shRNA cells, while ** indicates P<0.01 compared with hTERT-shRNA cells); (C) Expression of apoptosis-related proteins in each group after irradiation at 4 Gy.