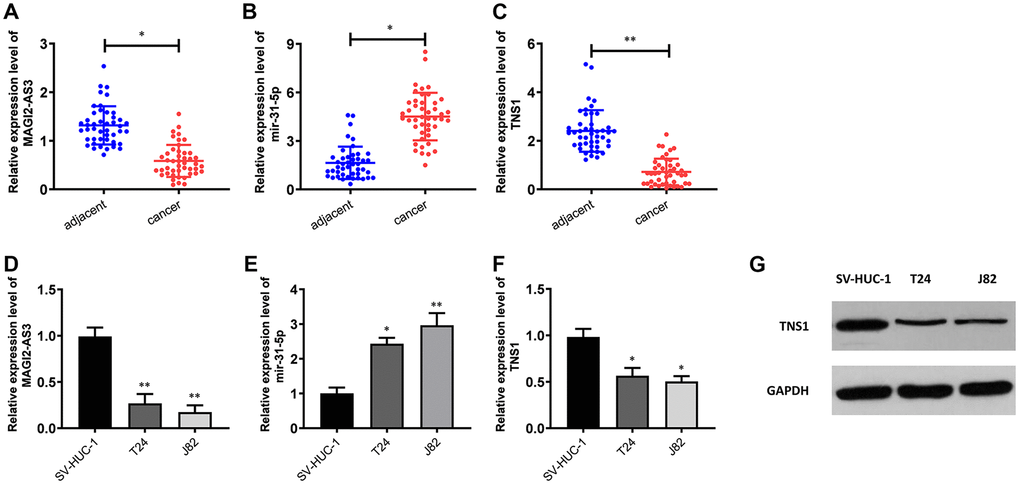
Figure 2.Expression levels of MAGI2-AS3, miR-31-5p and TNS1 in BCa tissues and cell lines. (A–C) QRT-PCR analysis results show the expression levels of MAGI2-AS3, miR-31-5p and TNS1 in BCa and adjacent normal tissues (n=45). (D–F) QRT-PCR analysis results show the expression levels of MAGI2-AS3, mir-31-5p and TNS1 in the normal urothelial cell line (SV-HUC-1) and BCa cell lines (T24 and J82). (G) Western blot analysis shows the expression of TNS1 in the normal urothelial cell line (SV-HUC-1) and BCa cell lines (T24 and J82). GAPDH was used as an internal control. *p<0.05. **p<0.01.