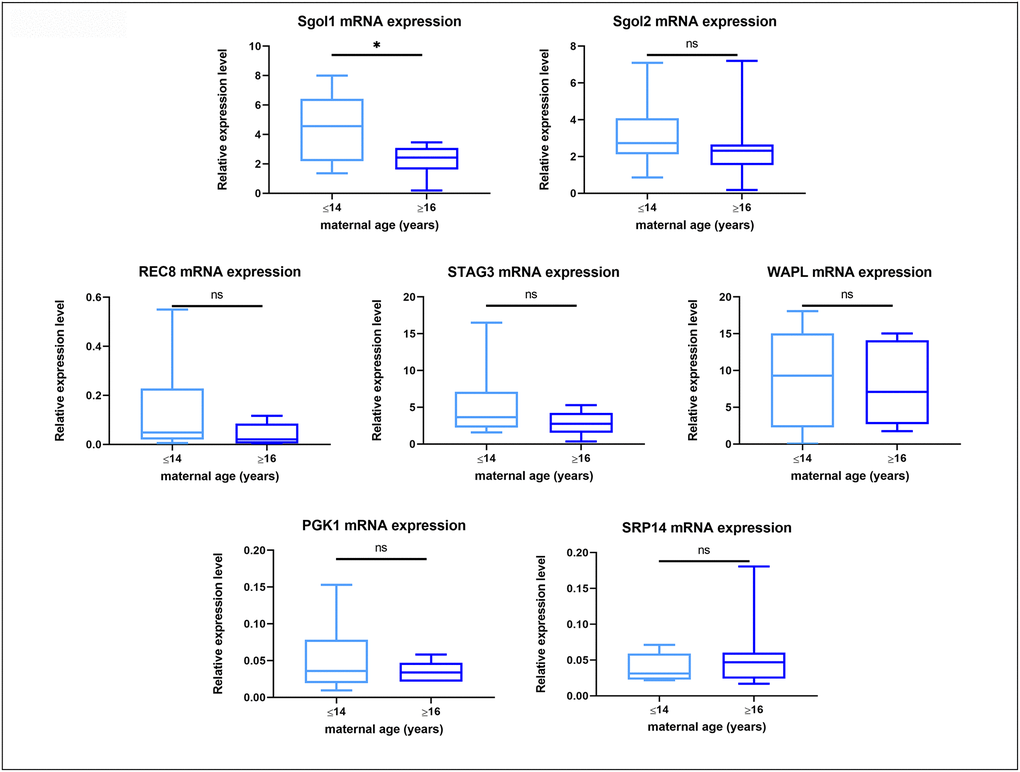
Figure 5.Box plot showing mRNA expression for housekeeping genes and target genes in oocytes from young (≤14 years) and old (≥16 years) mares. The boxes show the interquartile range, with the median value indicated by the horizontal line; whiskers show the range. *P < 0.05.