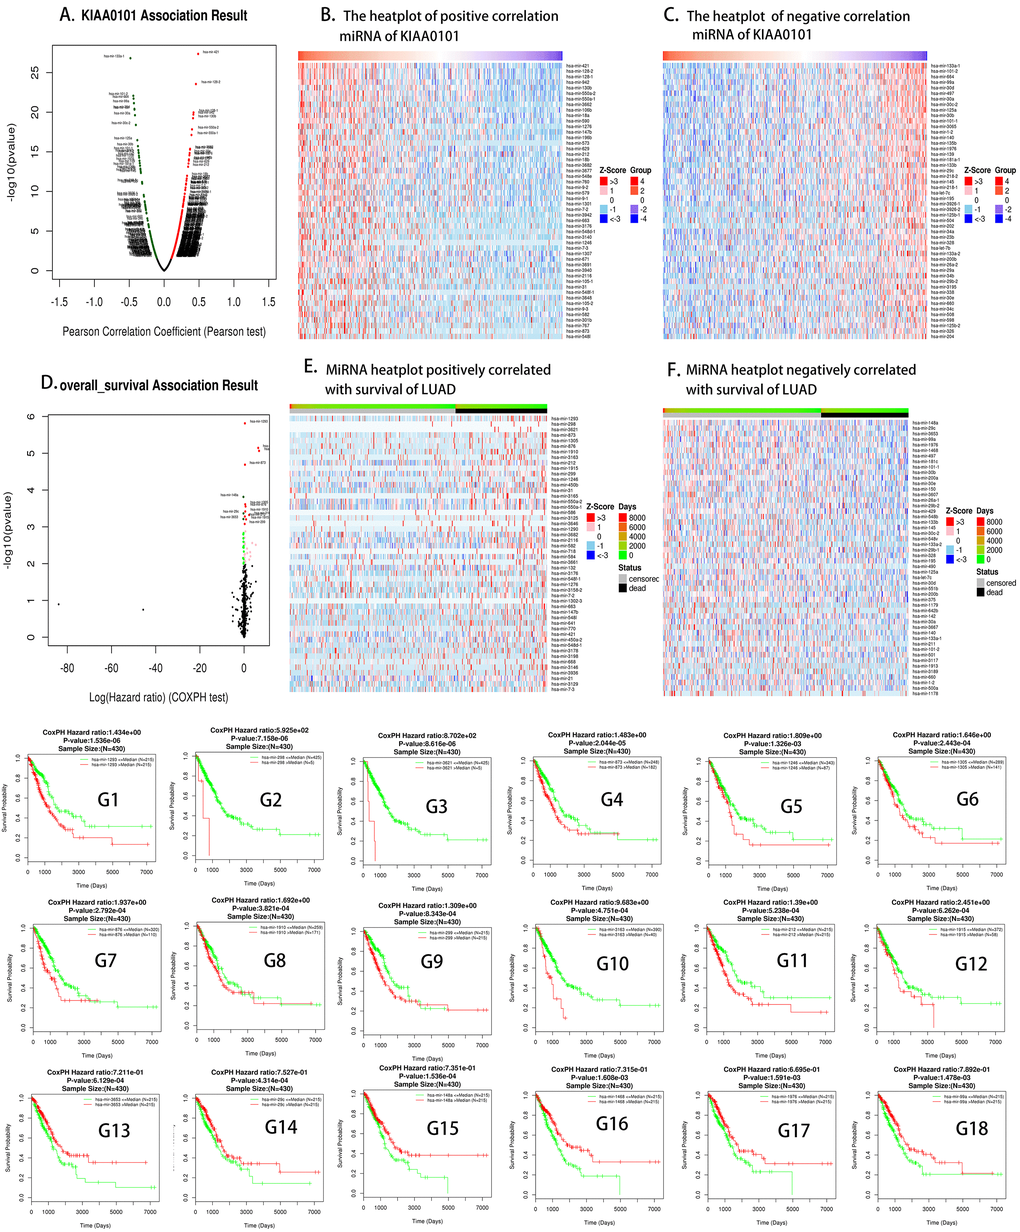
Figure 5.KIAA0101 highly correlated miRNAs. (A) Volcano plot of KIAA0101 related miRNAs; (B, C) positively and negatively correlated significant miRNA heat plots of KIAA0101. (D) The miRNA volcano map related to the overall survival of LUAD; (E, F) miRNAs positively and negatively related to the overall survival of LUAD, respectively; (G1–G18) the survival curves of KIAA0101 related miRNAs; green represents low expression of the corresponding miRNA, while red represents high expression of the corresponding miRNA.