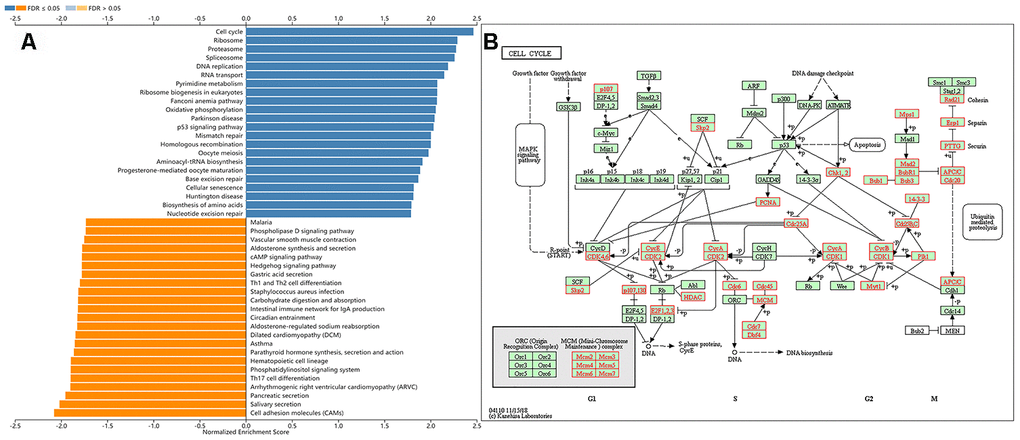
Figure 3.Gene set enrichment analysis of the KIAA0101 via the KEGG pathway. (A) Bar chart for gene set enrichment analysis of the KIAA0101 via the KEGG pathway. (B) KEGG pathway annotations of the cell cycle pathway (hsa04110). Red denotes leading edge genes; green denotes the remaining genes.