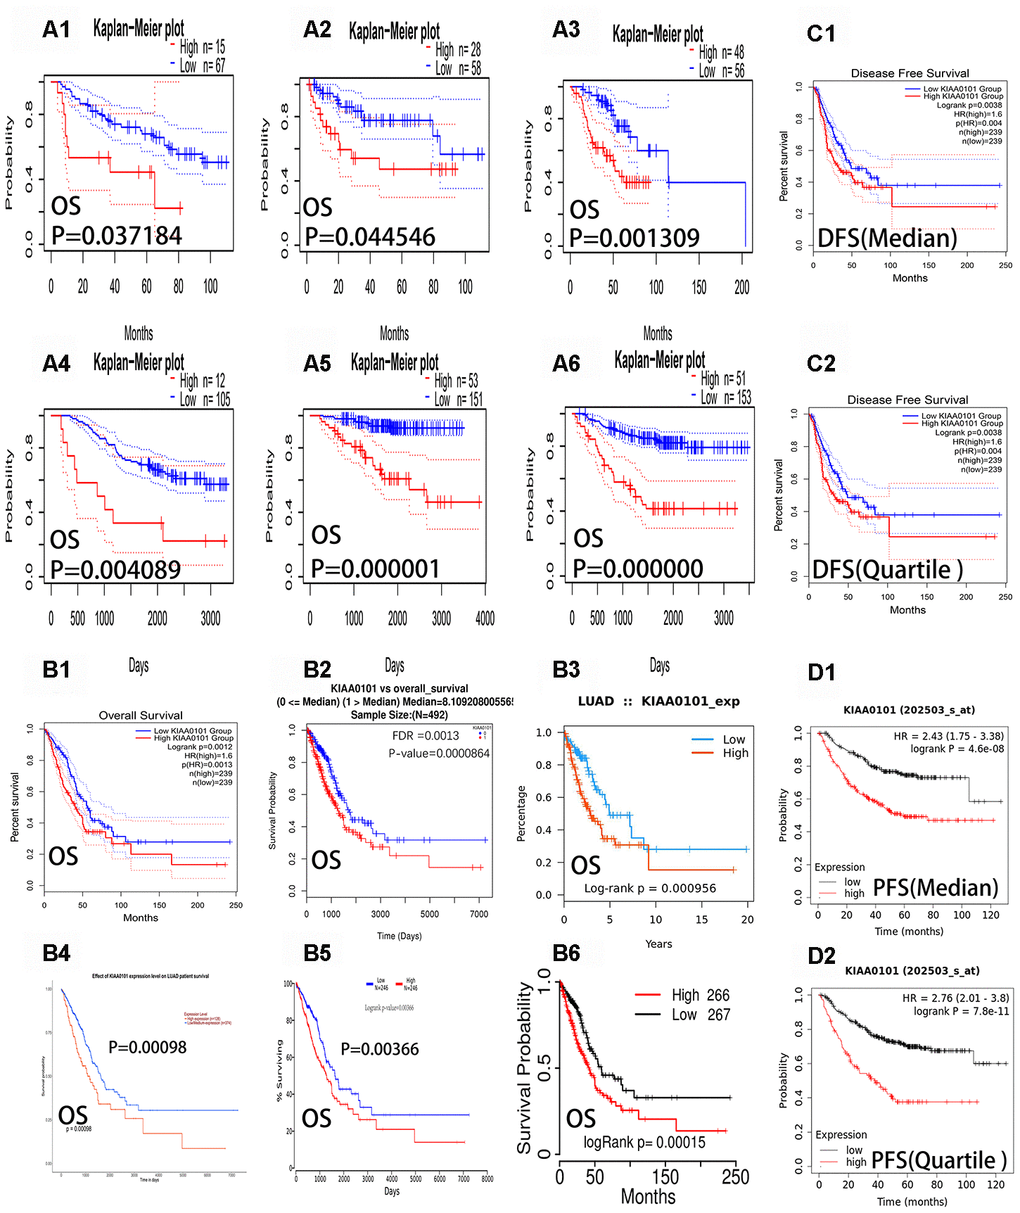
Figure 2.Overall survival curves, progression-free survival curves and disease-free survival curves of KIAA0101 in lung adenocarcinoma. The blue curves represent patients with lung adenocarcinoma with low expression of KIAA0101, and the red curves represent patients with lung adenocarcinoma with high expression of KIAA0101. (A1–A6) Six survival curves representing the six different data sets in Table 1 (from PrognoScan databases), respectively. (B1–B6) The six overall survival curves from the GEPIA, Linkedmics, Ualcan, TISIDB, Oncolnc, and TCGA portal databases, respectively. (C1–C2) Disease free survival curves (DFS) of KIAA0101 from the GEPIA database. (D1–D2) Progression free survival curves (PFS) of KIAA0101 from Kaplan Meier-plotter.
Figure 2 — KIAA0101 as a new diagnostic and prognostic marker, and its correlation with gene regulatory networks and immune infiltrates in lung adenocarcinoma | Aging