Submit an Article
Navigate
Home
Editorial Board
Editorial Policies
Current Volume
Archive
Scientific Integrity
Publication Ethics Statements
Interviews with Outstanding Authors
Newsroom
Sponsored Conferences
Podcast
Contact
Special Collections
Submit an Article
Online ISSN: 1945-4589
Research Paper
|
Volume 12, Issue 20
|
pp. 19979–20000
Interplay between gonadal hormones and postnatal overfeeding in defining sex-dependent differences in gut microbiota architecture
Back to article
Figure 5
(7 of 8)
−
100%
+
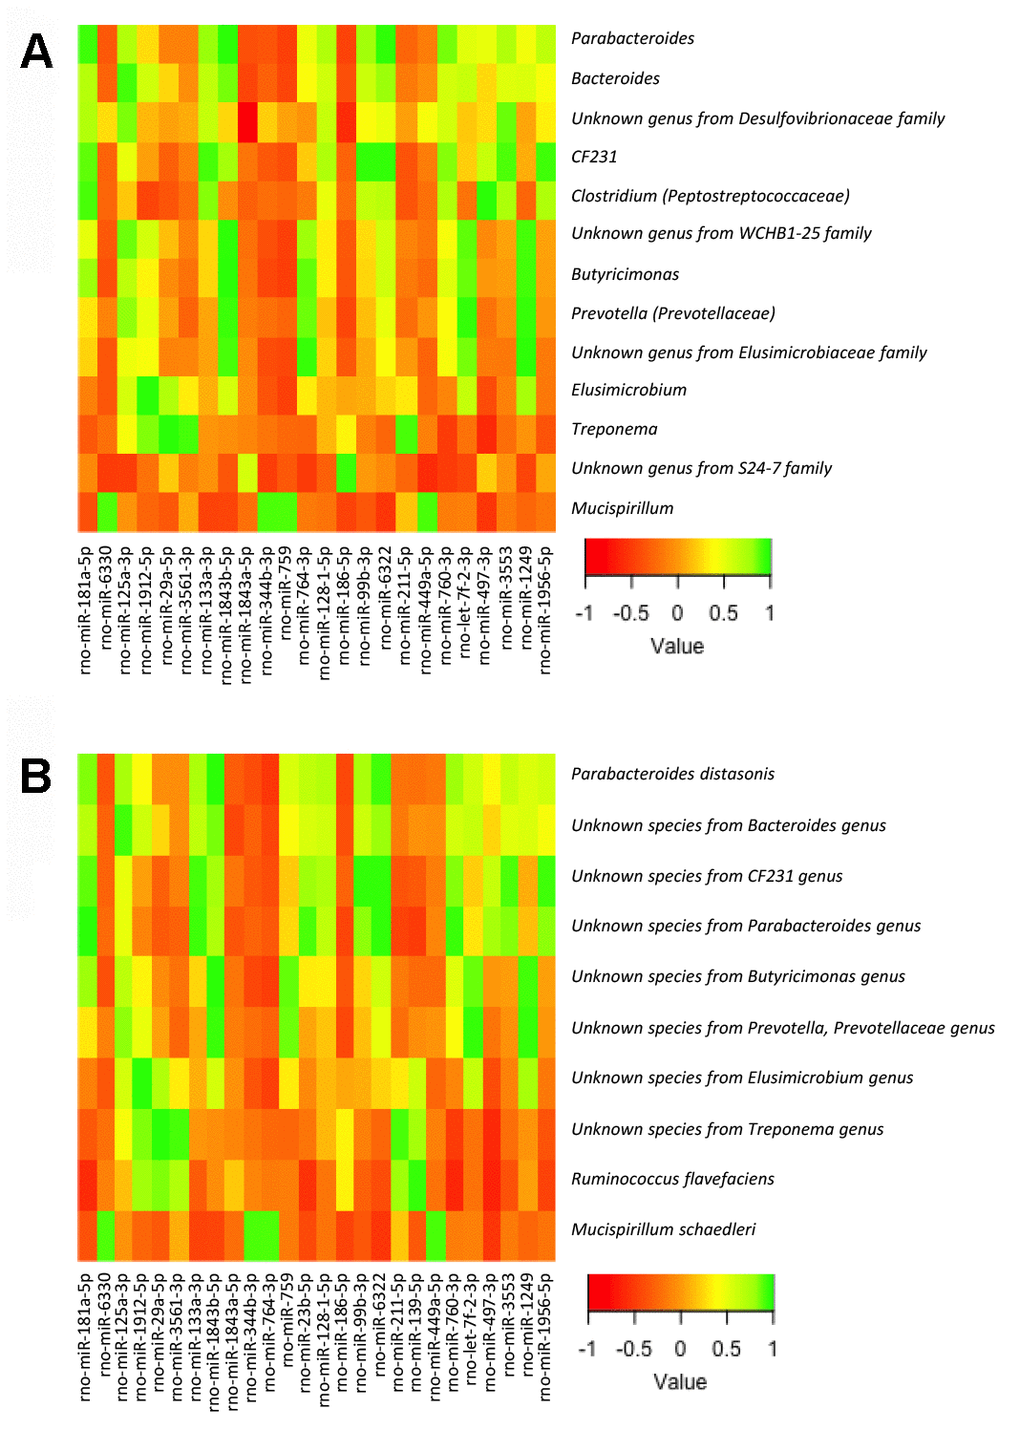
Figure 5.
Heatmap from the Pearson’s correlation coefficient between the bacterial genera (
A
) and species (
B
) identified by LEfSe analysis and the expression levels of the miRNAs in the small intestine.