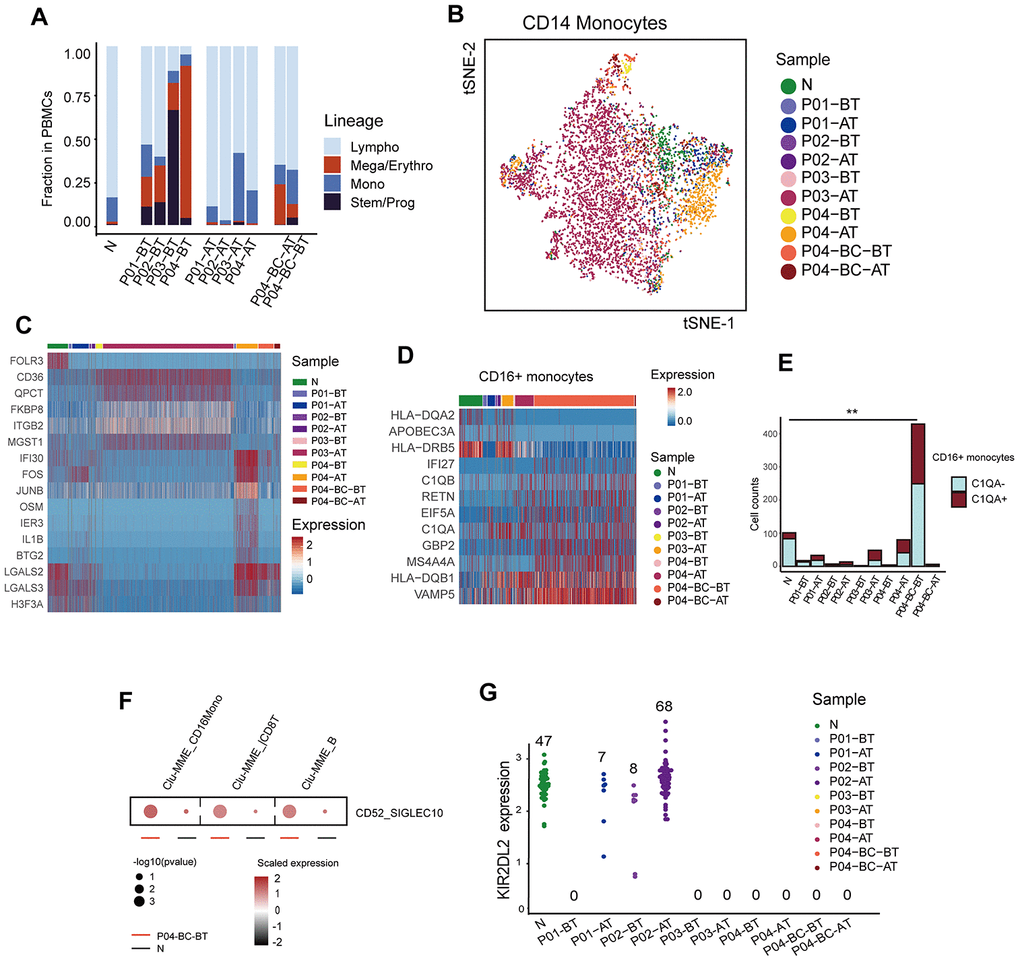
Figure 5.Modulation of the immune structure in response to imatinib treatment (A) Bar plots showing the fraction of different cell lineages in each sample. (B) TSNE plot of the re-clustering result of CD14+ monocytes. Cells are highlighted in colors indicating sample of origin. The number of cells in each cluster is listed in Supplementary Table 2. (C) Heatmap displaying the expression profiles of CD14+ monocytes across different samples. Top differentially expressed genes in each sample are indicated. (D) Heatmap comparing the expression profiles of CD16+ monocytes across different samples. The selected marker genes are indicated. (E) Bar plots comparing the detected C1QA-expressing monocytes across different samples. P value was calculated using a Fisher’s exact test. (F) Dot plots comparing the CD52-SIGLECT10 ligand-receptor interactions between P04-BC-BT and N. The p value was calculated using a permutation test. (G) Beeswarm plots showing the expression of KIR2DL2 among all cells across samples. The number of cells expressing KIR2DL2 in each sample is indicated.
Figure 5 — Single cell sequencing reveals cell populations that predict primary resistance to imatinib in chronic myeloid leukemia | Aging