Submit an Article
Navigate
Home
Editorial Board
Editorial Policies
Current Volume
Archive
Scientific Integrity
Publication Ethics Statements
Interviews with Outstanding Authors
Newsroom
Sponsored Conferences
Podcast
Contact
Special Collections
Submit an Article
Online ISSN: 1945-4589
Research Paper
|
Volume 12, Issue 24
|
pp. 25304–25318
Identification of novel prognostic biomarkers in renal cell carcinoma
Back to article
Figure 4
(4 of 8)
−
100%
+
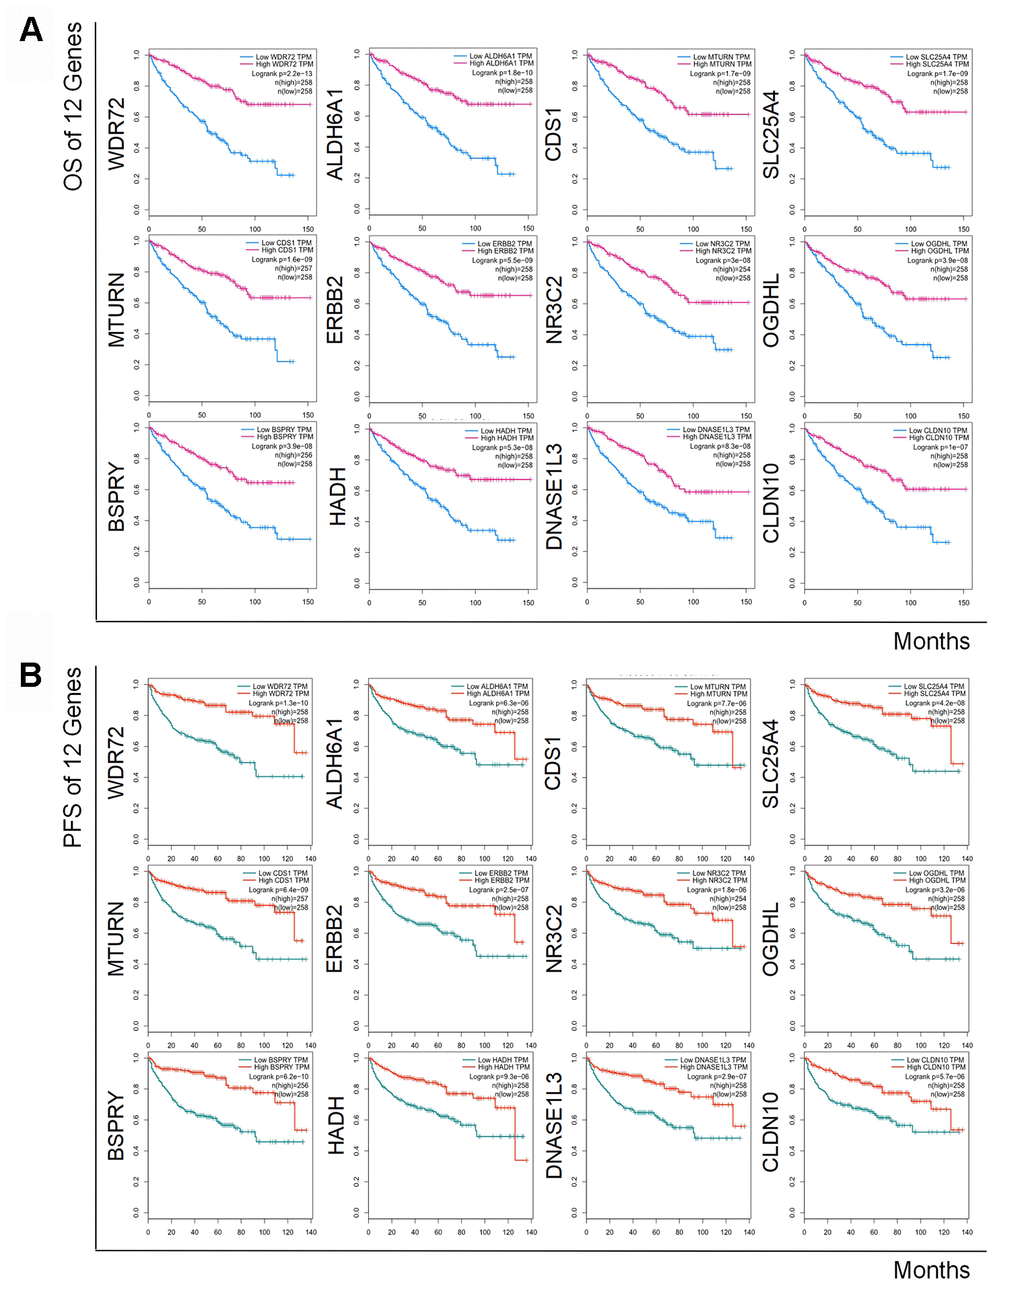
Figure 4.
Kaplan-Meier curves of OS and DFS of 12 prognostic coding genes.
Lower expression of all 12 coding genes was relevant to both unfavorable OS (
A
) and worse DFS (
B
) in patients with RCC.