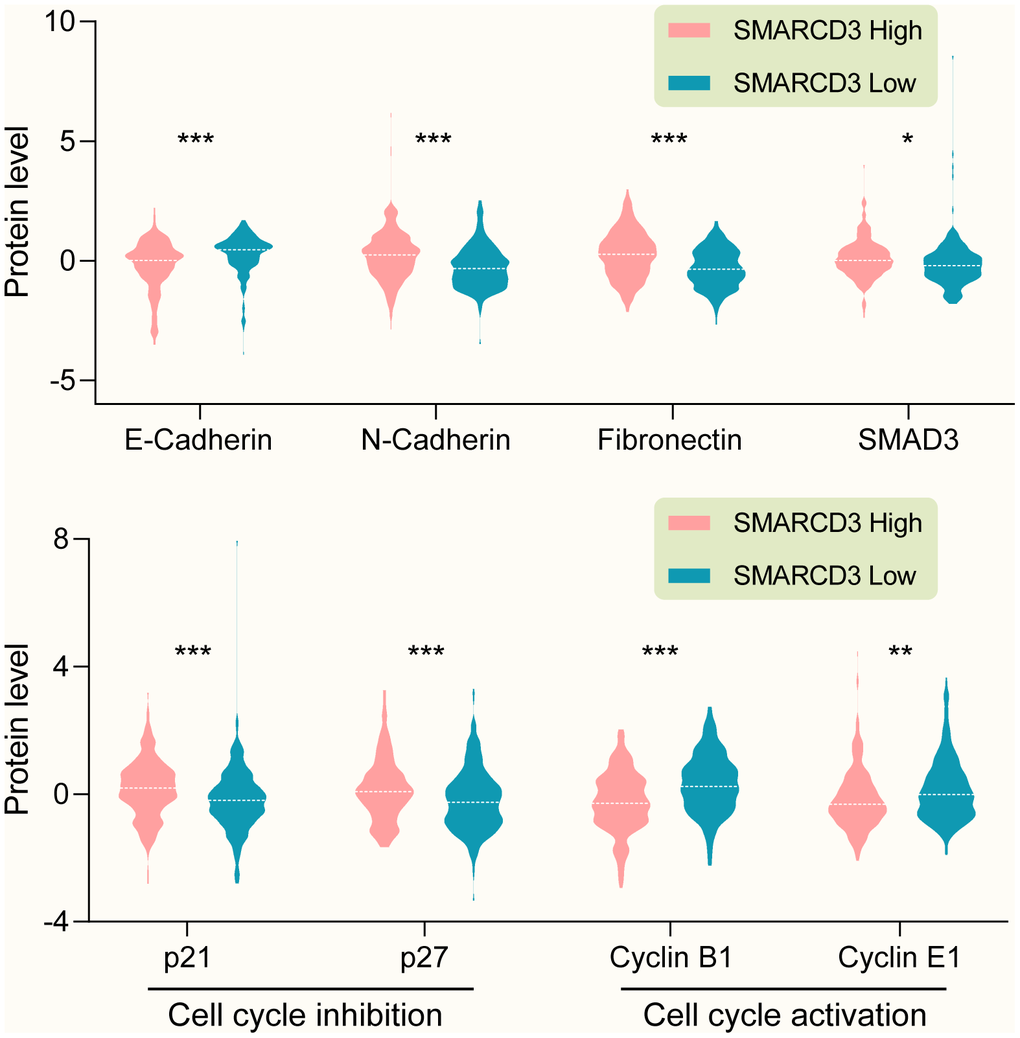
Figure 8.(Upper graph) SMARCD3 expression is negatively correlated with E-Cadherin, while positively correlated with N-Cadherin, Fibronectin and SMAD3. (Lower graph) SMARCD3 expression is positively correlated with cell cycle inhibitor p21 and p27, while negatively correlated with cell cycle activator Cyclin B1 and Cyclin E1.