Submit an Article
Navigate
Home
Editorial Board
Editorial Policies
Current Volume
Archive
Scientific Integrity
Publication Ethics Statements
Interviews with Outstanding Authors
Newsroom
Sponsored Conferences
Podcast
Contact
Special Collections
Submit an Article
Online ISSN: 1945-4589
Research Paper
|
Volume 12, Issue 20
|
pp. 20835–20861
SMARCD3 is a potential prognostic marker and therapeutic target in CAFs
Back to article
Figure 3
(3 of 9)
−
100%
+
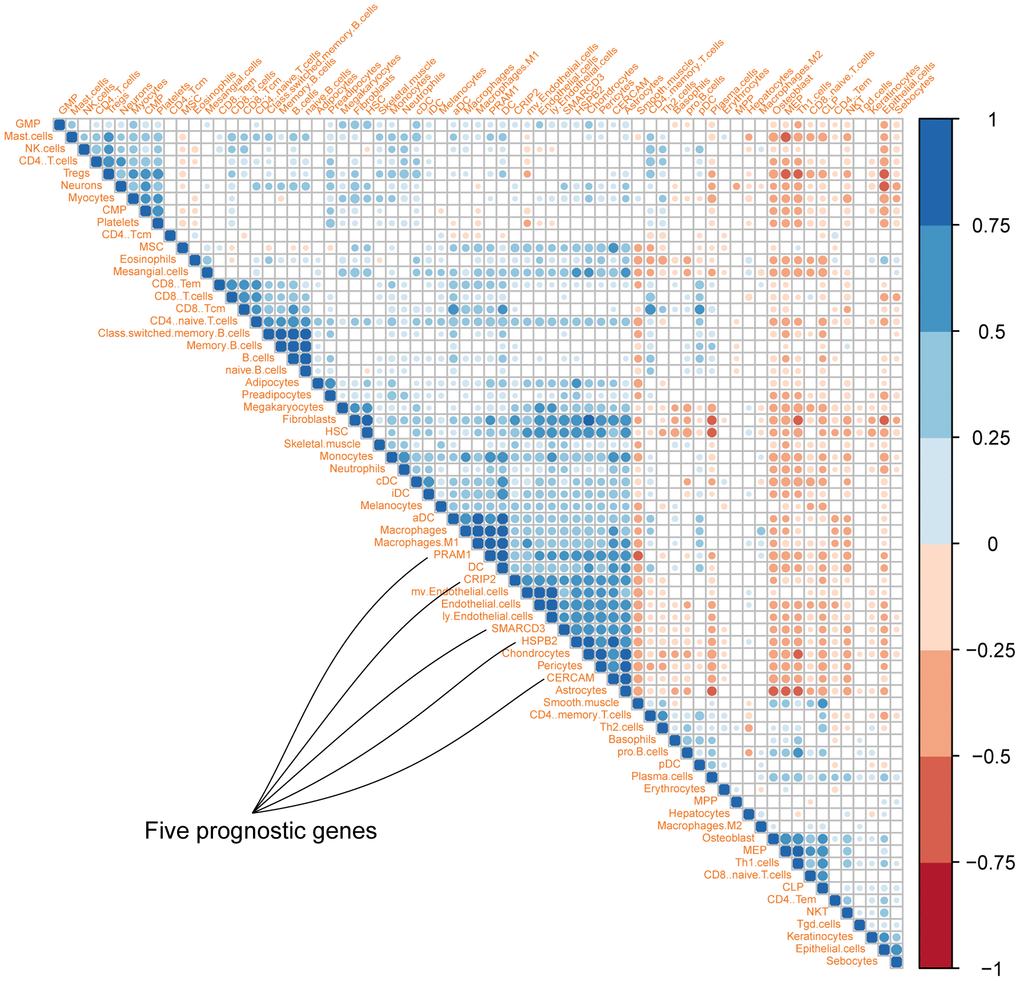
Figure 3.
Correlation map of five genes with different cell types in colon cancer microenvironment (Different colors represent spearman r values).