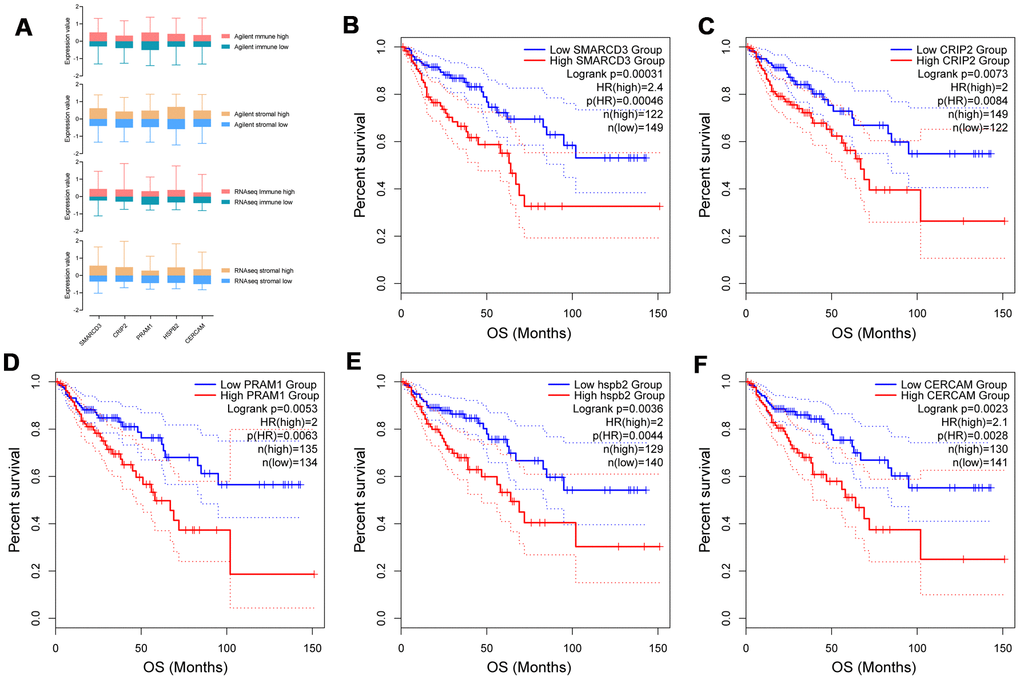
Figure 2.Expression of SMARCD3, CRIP2, PRAM1, HSPB2 and CERCAM in groups with different immune or stromal scores (A). Kaplan-Meier survival analysis based on expression value of these genes using TCGA COAD data (B–F).
Figure 2 — SMARCD3 is a potential prognostic marker and therapeutic target in CAFs | Aging