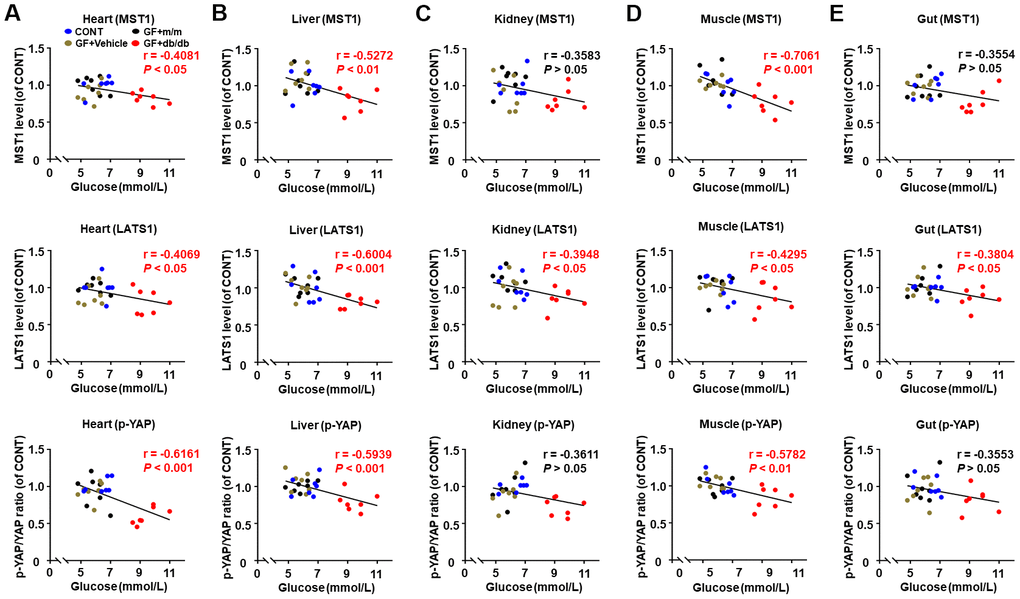
Figure 6.Correlations between fasting blood glucose and Hippo signaling levels in peripheral tissues after fecal transplantation in pseudo germ-free mice (n = 28). MST1, LATS1 and p-YAP/YAP ratio in the heart (A), liver (B), kidney (C), muscle (D), and gut (E).