Submit an Article
Navigate
Home
Editorial Board
Editorial Policies
Current Volume
Archive
Scientific Integrity
Publication Ethics Statements
Interviews with Outstanding Authors
Newsroom
Sponsored Conferences
Podcast
Contact
Special Collections
Submit an Article
Online ISSN: 1945-4589
Research Paper
|
Volume 12, Issue 23
|
pp. 24156–24167
Gut microbiota transplantation from db/db mice induces diabetes-like phenotypes and alterations in Hippo signaling in pseudo germ-free mice
Back to article
Figure 1
(1 of 6)
−
100%
+
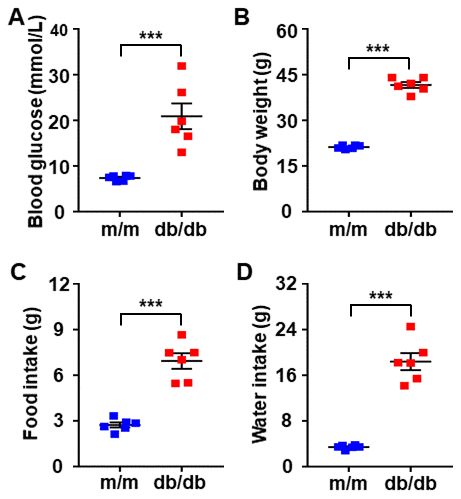
Figure 1.
Comparisons of metabolic parameters in db/db and m/m mice.
(
A
) Blood glucose. (
B
) Body weight. (
C
) Food intake. (
D
) Water intake. Data are shown as mean ± SEM (
n
= 6). *
P
< 0.05, **
P
< 0.01, or ***
P
< 0.001. N.S., not significant.