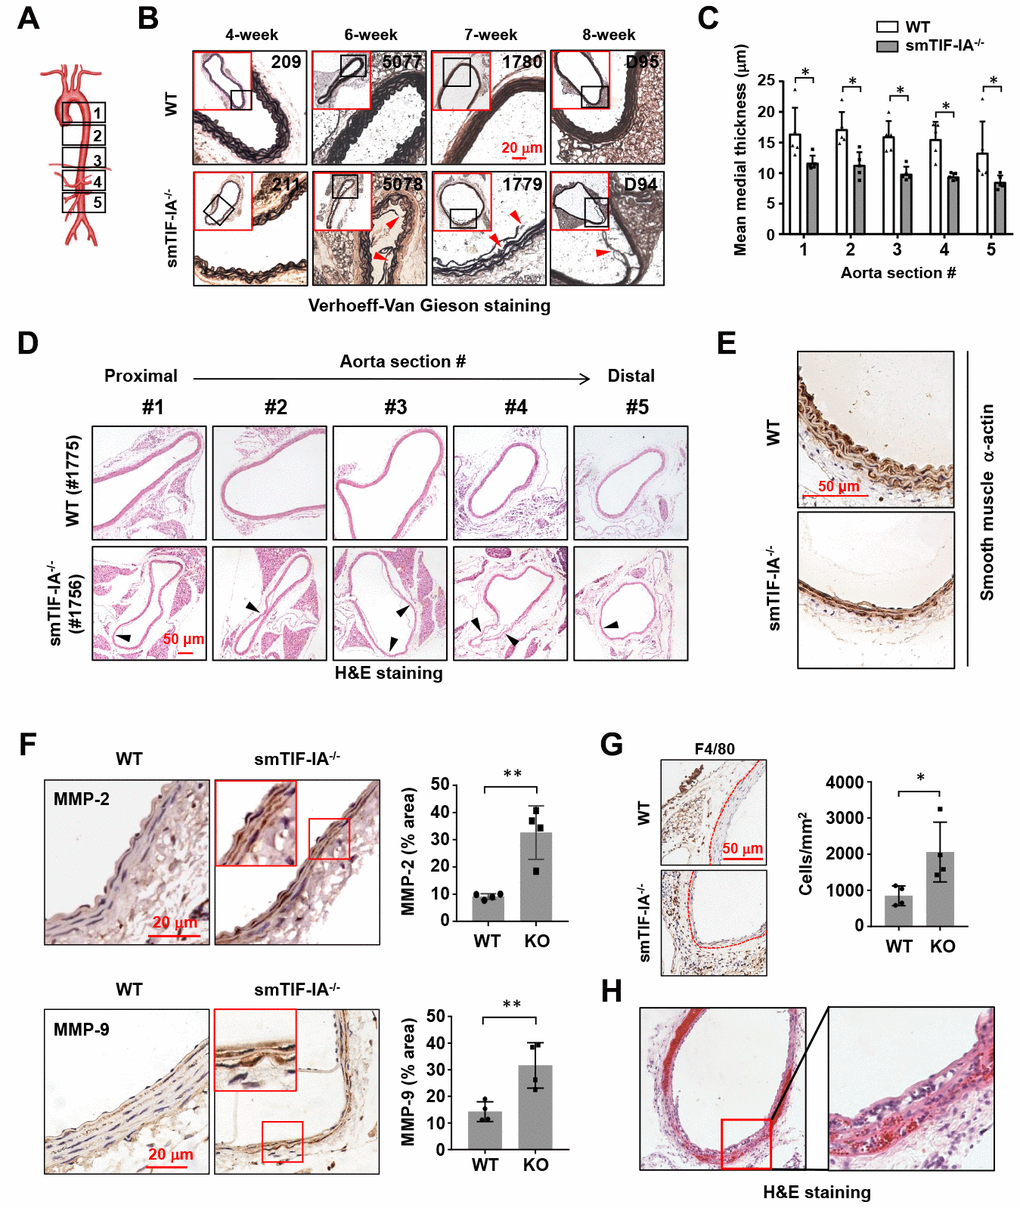
Figure 2.Smooth muscle-specific nucleolar stress induction by TIF-IA deletion (smTIF-IA-/-) resulted in aneurysm-like lesions in the aorta. (A) Depiction of sampling locations along the aorta for histopathological examinations. The aorta was divided into five parts from the proximal to the distal end. (B) Representative images of Verhoeff-Van Gieson staining of abdominal aortas (section #4 as shown in A) from sex-matched littermate wild type (WT) and smTIF-IA-/- animals of different age. The red-outlined insets were low power images indicating the area where the corresponding high power images were taken. Sites with elastic laminar derangements were indicated by arrowheads. Animal identification tag numbers were shown at the top right corner. (C) Changes in the mean medial thickness of smTIF-IA-/- aorta as compared to WT controls (n = 5). (D) H&E staining images showing multiple aneurysm-like lesions (arrowheads) throughout a single aorta from smTIF-IA-/- animal. (E) Immunohistochemical staining for smooth muscle α-actin (brown color) showing diminished smooth muscle cells in smTIF-IA-/- aorta. (F) Immunohistochemical staining (brown color) and semi-quantitative data showing the increased levels of matrix metalloproteinase (MMP)-2 and MMP-9 in smTIF-IA-/- (KO) aorta (n = 4). High power images were shown in red boxes. (G) F4/80 staining and quantitative data showing increased accumulation of macrophages in smTIF-IA-/- abdominal aorta (n = 4). Dashed lines indicated the media-adventitia border. (H) Low and high power images of the abdominal aorta from one smTIF-IA-/- animal sacrificed alive at 9 weeks showing abundant intramural red blood cells (H&E staining), indicating the presence of aortic dissection. Quantitative data were expressed as dot blot-combined bar graphs representing mean ± S.D. * P < 0.05, ** P < 0.01, unpaired t-test.