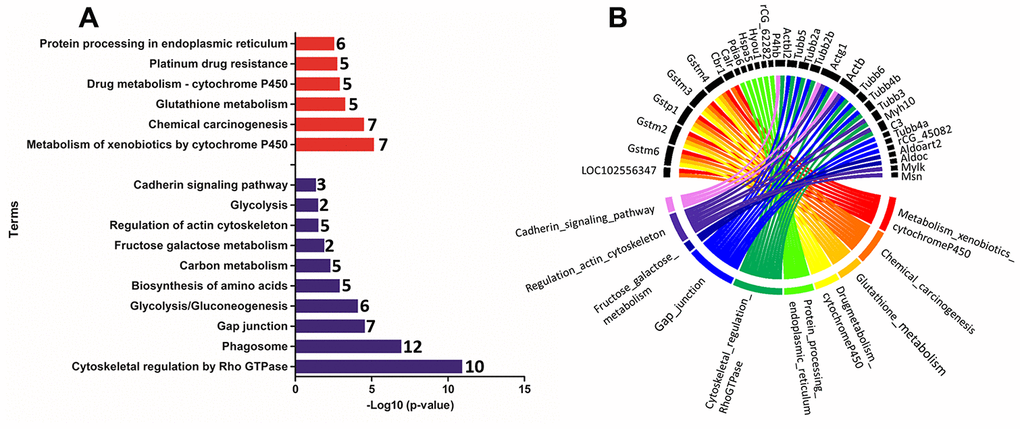
Figure 5.(A) Ontological enrichment of upregulated (red) and downregulated (blue) proteins on PND 540 using the KOBAs 3.0 tool. All data were expressed as -Log10 (p-value). (B) The Circus plot graphic identifying the top 10 enriched terms and the DEP associated with each term.