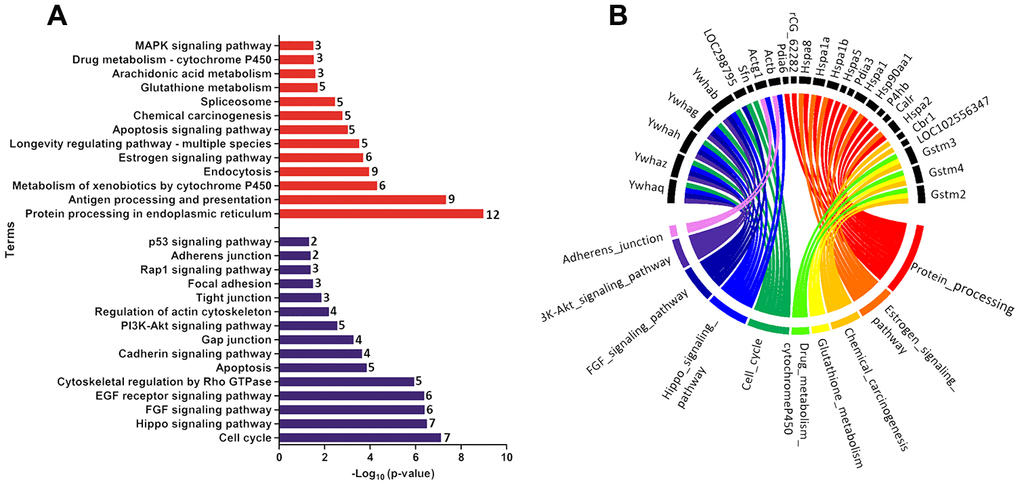
Figure 4.(A) Ontological enrichment of upregulated (red) and downregulated (blue) proteins on PND 21 by KOBAs 3.0. All data were expressed as -Log10 (p-value). (B) Circus plot graphic identifying the top 10 enriched terms and the DEP associated with each term. The numbers in front of the bars mean the number of proteins that enriched each term.