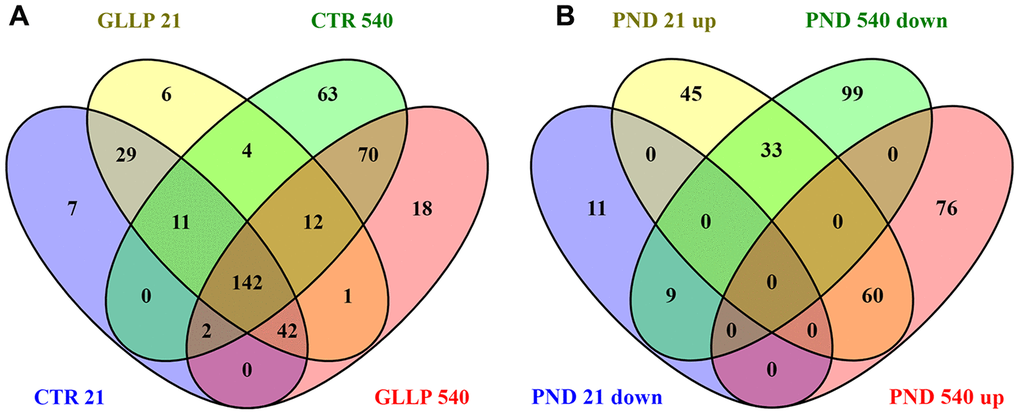
Figure 3.Venn diagram. (A) Shared proteins between CTR and GLLP groups in PND 21 and 540. (B) Shared proteins differentially expressed between the CTR and GLLP groups on PND 21 and 540. CTR = Control; GLLP = Gestational and lactational low protein; PND = Postnatal day; up = upregulated proteins; down = downregulated proteins.