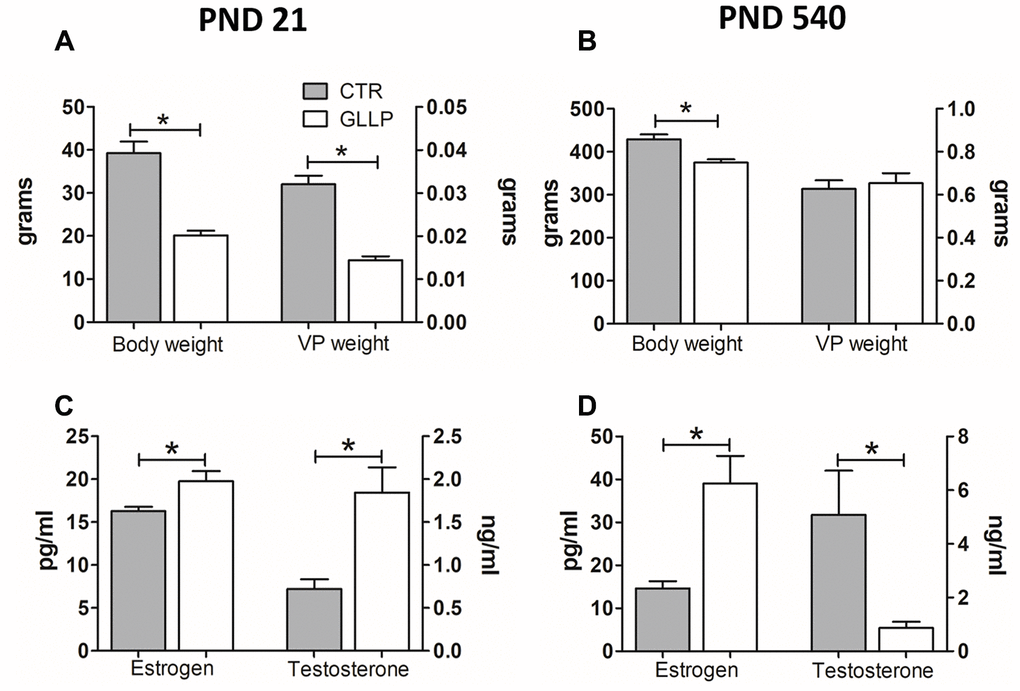
Figure 1.Body weight (A, B) and hormonal levels (C, D) of male offspring on PND 21 and 540. All data are expressed as mean±SD. Asterisks (*) represent statistical differences between experimental groups with p<0.05. CTR = control; GLLP = gestational and lactational low protein; PND = postnatal day; VP = ventral prostate.