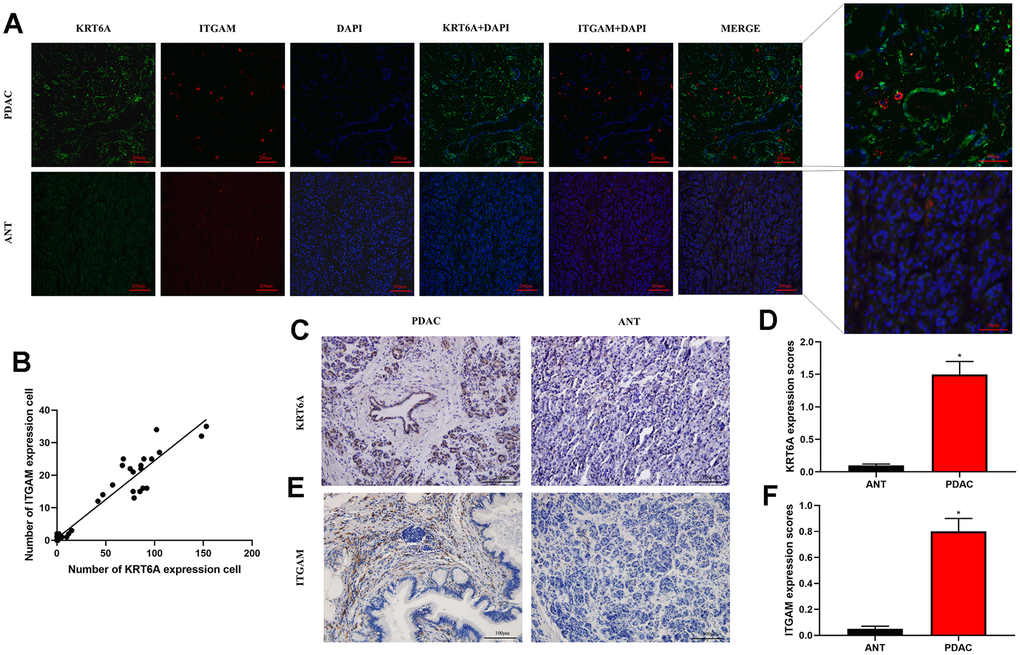
Figure 8.Immunofluorescence and immunohistochemistry (IHC) staining by integrating KRT6A and ITGAM expression. (A) Immunofluorescence staining of KRT6A (green) and ITGAM (red) in PDAC and ANT frozen tissue sections (100×). (B) Pearson's correlation of KRT6A and ITGAM expressing cells in PDAC and ANT. (C–F) IHC staining of KRT6A (c) and ITGAM (e) in PDAC and ANT (200×). Column charts were shown in (D) for KRT6A and (F) for ITGAM. *p<0.001.