Submit an Article
Navigate
Home
Editorial Board
Editorial Policies
Current Volume
Archive
Scientific Integrity
Publication Ethics Statements
Interviews with Outstanding Authors
Newsroom
Sponsored Conferences
Podcast
Contact
Special Collections
Submit an Article
Online ISSN: 1945-4589
Research Paper
|
Volume 12, Issue 22
|
pp. 23217–23232
Alteration of tumor-associated macrophage subtypes mediated by KRT6A in pancreatic ductal adenocarcinoma
Back to article
Figure 5
(5 of 10)
−
100%
+
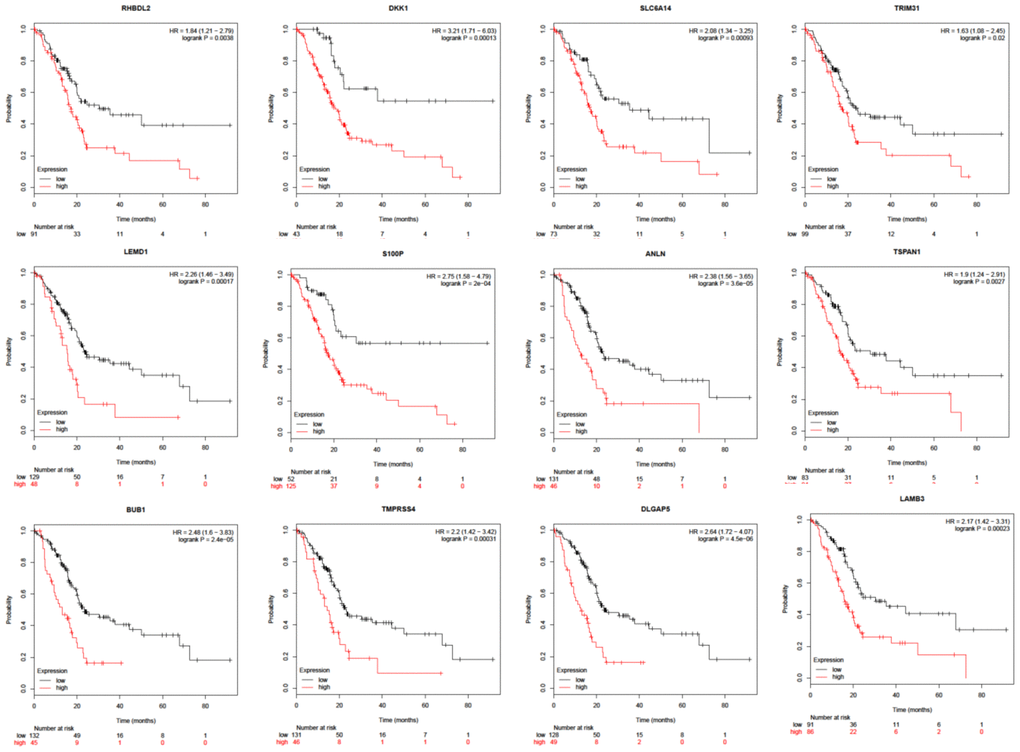
Figure 5.
Survival analysis of overlapped DEGs between PDAC and ANT in five datasets.
Figure 5 — Alteration of tumor-associated macrophage subtypes mediated by KRT6A in pancreatic ductal adenocarcinoma | Aging