Submit an Article
Navigate
Home
Editorial Board
Editorial Policies
Current Volume
Archive
Scientific Integrity
Publication Ethics Statements
Interviews with Outstanding Authors
Newsroom
Sponsored Conferences
Podcast
Contact
Special Collections
Submit an Article
Online ISSN: 1945-4589
Research Paper
|
Volume 12, Issue 22
|
pp. 23200–23216
Development and validation of a nomogram with an epigenetic signature for predicting survival in patients with lung adenocarcinoma
Back to article
Figure 8
(8 of 10)
−
100%
+
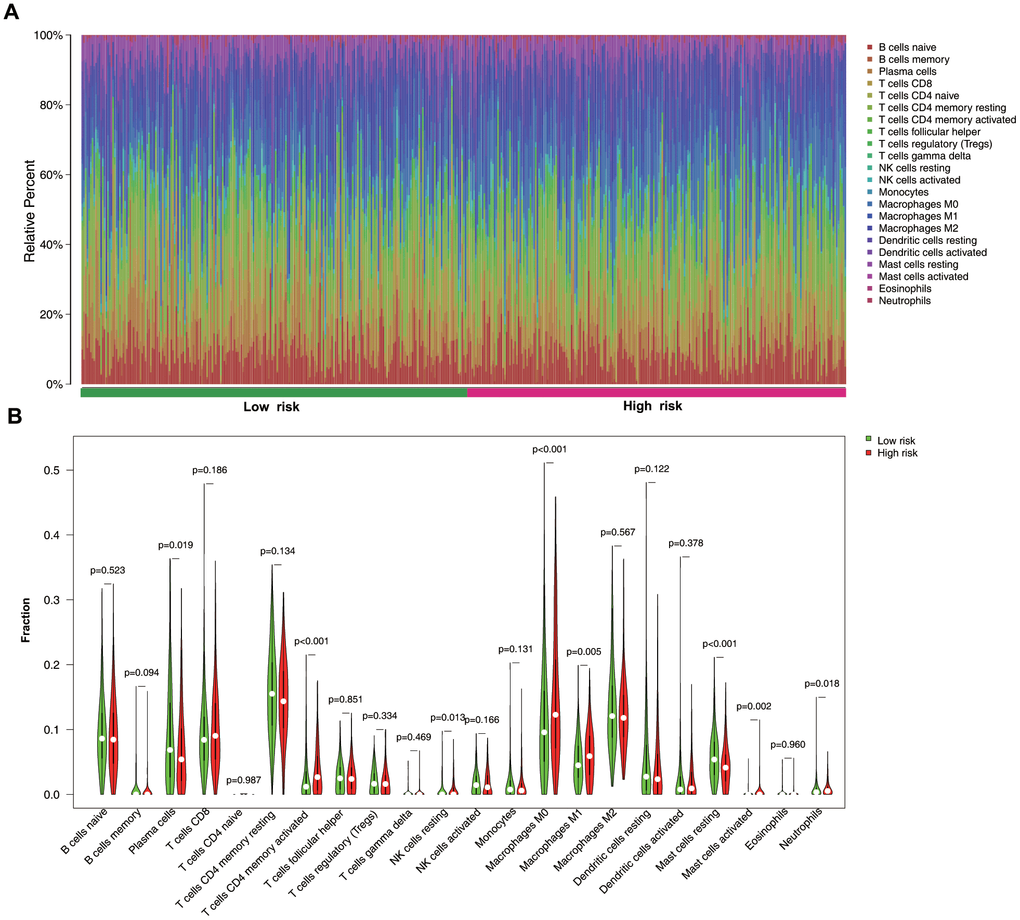
Figure 8.
Immune-cell distribution between low- and high-risk groups.
(
A
) Relative proportion of immune cells between two groups. (
B
) Violin plots immune-cell distribution between groups.