Submit an Article
Navigate
Home
Editorial Board
Editorial Policies
Current Volume
Archive
Scientific Integrity
Publication Ethics Statements
Interviews with Outstanding Authors
Newsroom
Sponsored Conferences
Podcast
Contact
Special Collections
Submit an Article
Online ISSN: 1945-4589
Research Paper
|
Volume 12, Issue 23
|
pp. 23450–23463
Incidence of cerebrovascular disease as a comorbidity in patients with COVID-19: a meta-analysis
Back to article
Figure 1
(1 of 6)
−
100%
+
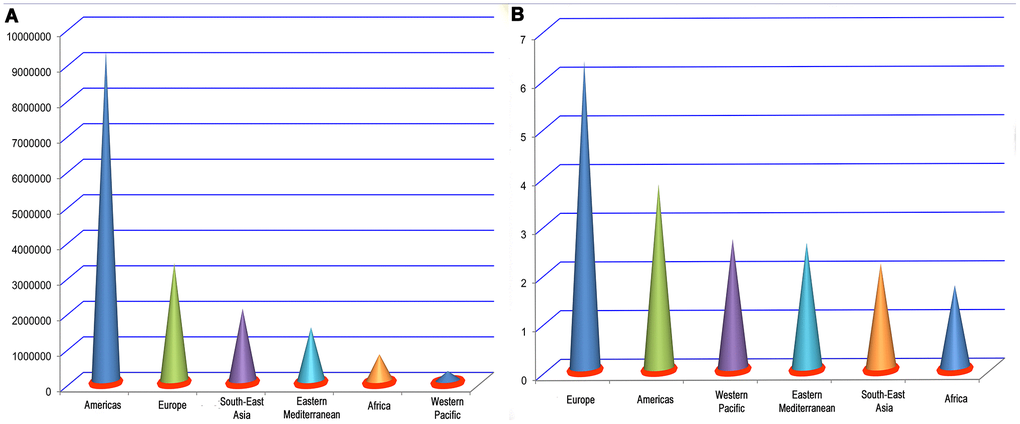
Figure 1.
Number of infections (
A
) and crude death rate (%) (
B
) by region.