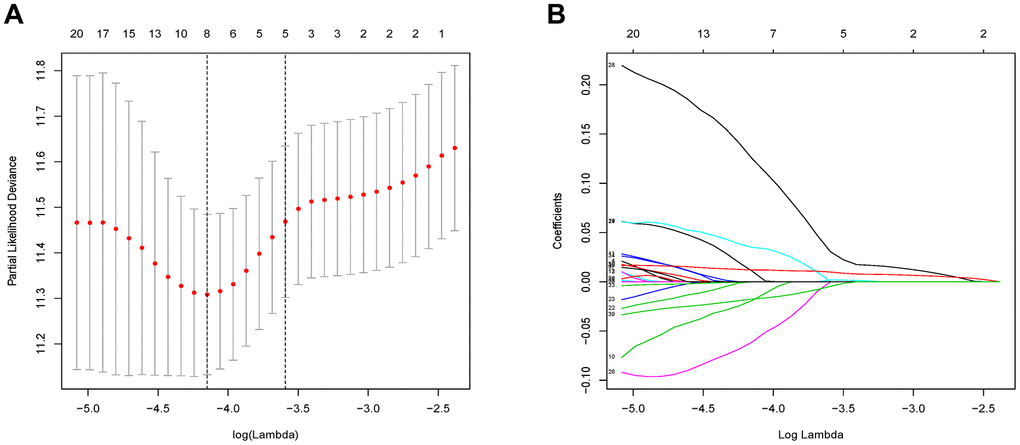
Figure 4.Flow chart and 10-fold cross-validation for tuning parameter selection. (A) 10-fold cross-validation for tuning parameter selection in the Lasso model. (B) LASSO coefficient profiles of the 46 prognostic genes. A vertical line is drawn at the value chosen by 10-fold cross-validation.