Submit an Article
Navigate
Home
Editorial Board
Editorial Policies
Current Volume
Archive
Scientific Integrity
Publication Ethics Statements
Interviews with Outstanding Authors
Newsroom
Sponsored Conferences
Podcast
Contact
Special Collections
Submit an Article
Online ISSN: 1945-4589
Research Paper
|
Volume 12, Issue 23
|
pp. 23917–23930
Molecular subtypes based on DNA promoter methylation predict prognosis in lung adenocarcinoma patients
Back to article
Figure 8
(8 of 8)
−
100%
+
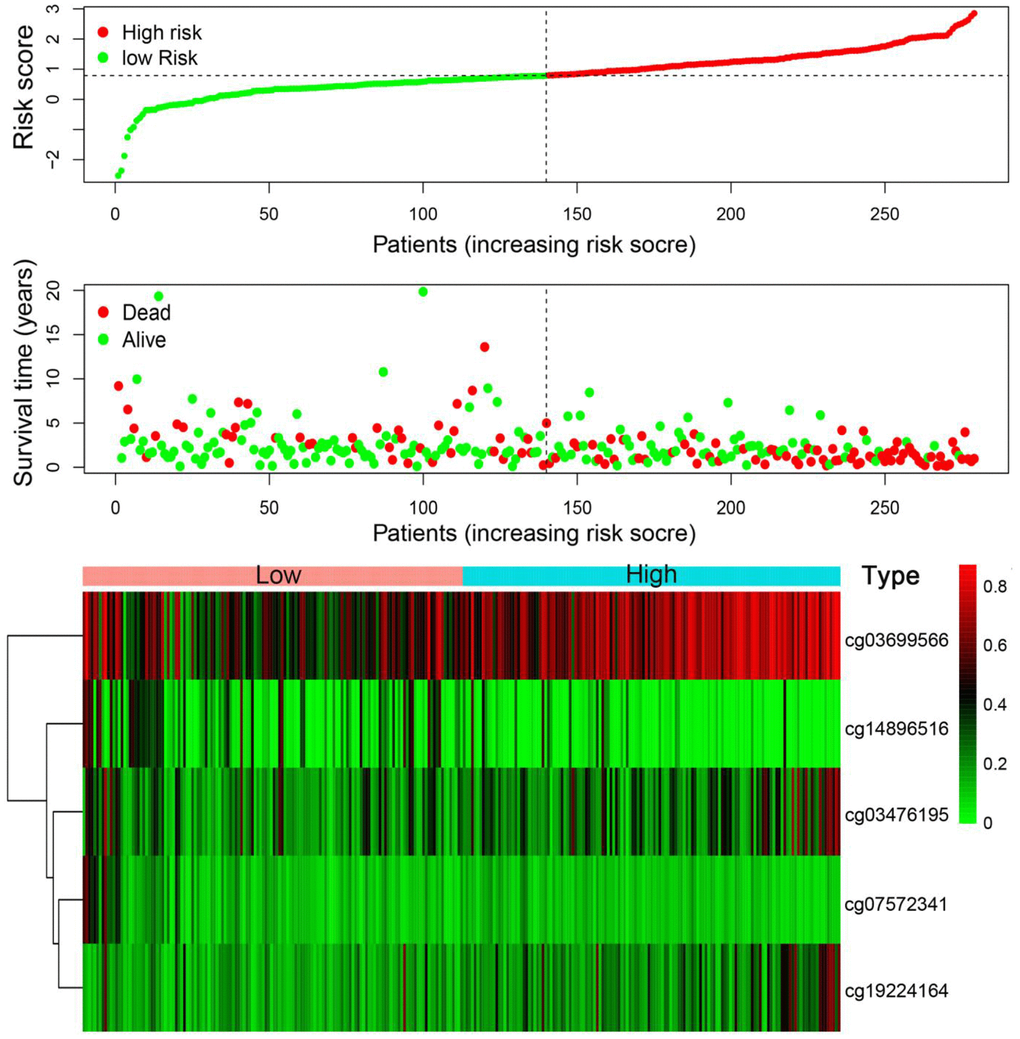
Figure 8.
Risk score analysis of the training set.
The five DNA methylation signature risk score distribution. Heat-map of the DNA methylation profiles. Rows represent CpG sites, and columns represent patients.