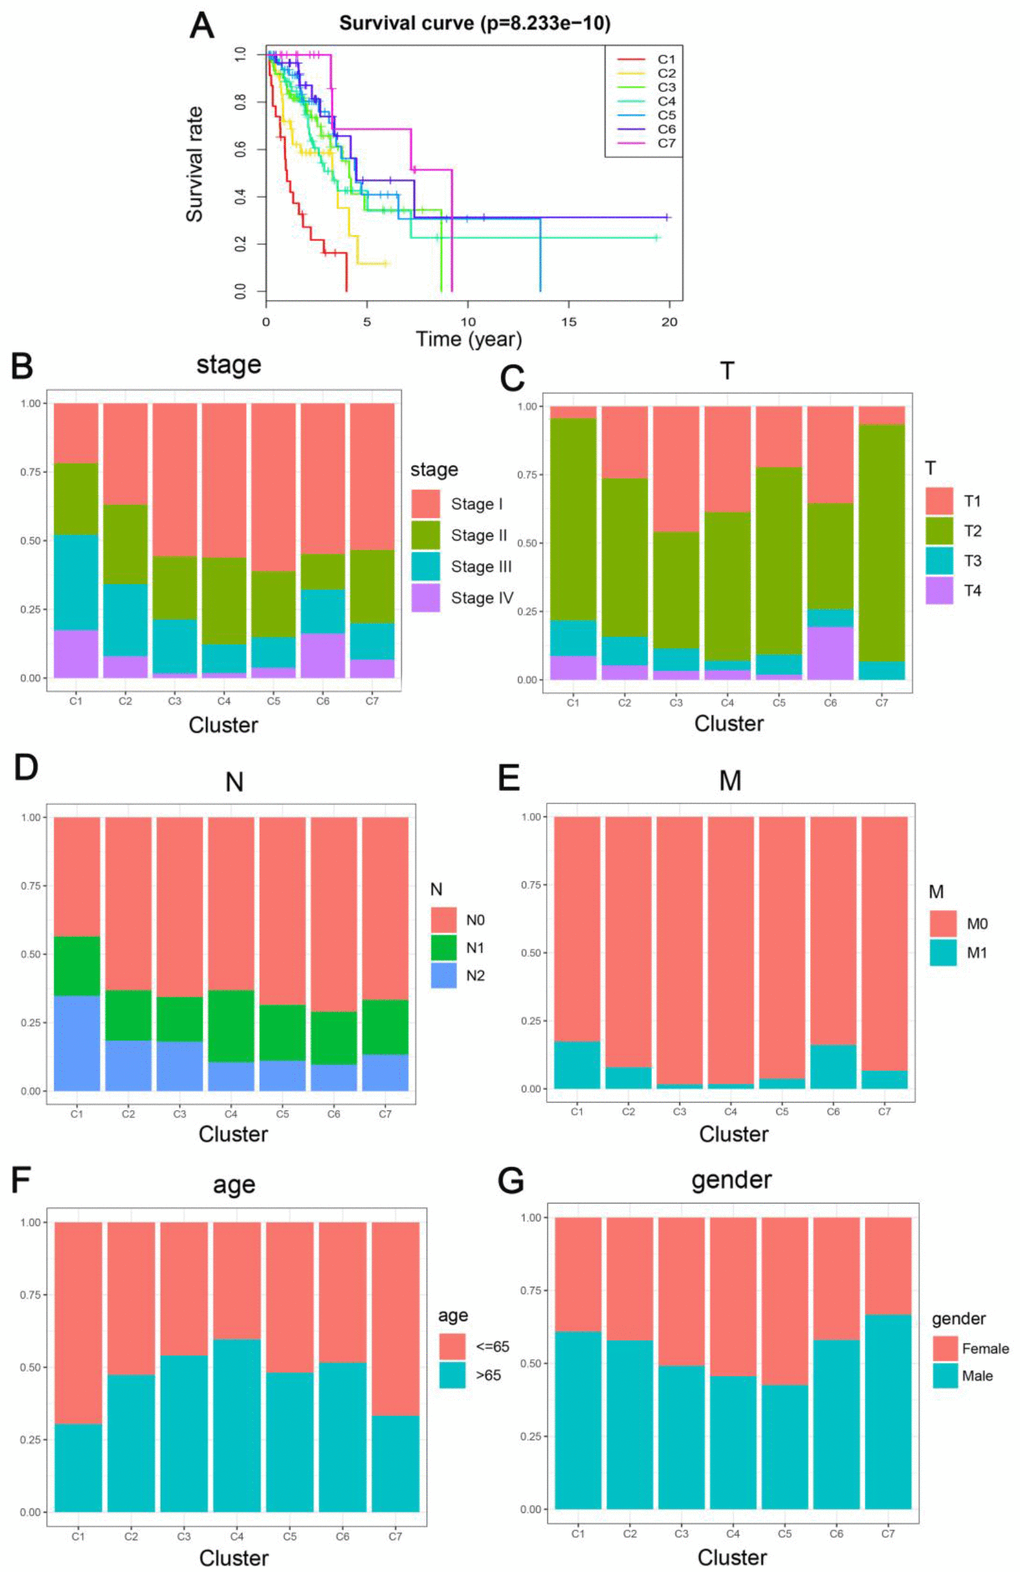
Figure 3.Comparison of prognosis, TNM stage, age, and gender between the DNA methylation clusters. (A) Survival curves for each DNA methylation subtype in the training set. The horizontal axis represents survival time (years), and the vertical axis represents the probability of survival. The log-rank test was used to assess the statistical significance of differences between subtypes. Stage score (B), topography score (C), lymphocyte infiltration (D), metastasis (E), age (F), and gender (G) distributions for each DNA methylation subtype in the training set. The horizontal axis represents the DNA methylation clusters.