Submit an Article
Navigate
Home
Editorial Board
Editorial Policies
Current Volume
Archive
Scientific Integrity
Publication Ethics Statements
Interviews with Outstanding Authors
Newsroom
Sponsored Conferences
Podcast
Contact
Special Collections
Submit an Article
Online ISSN: 1945-4589
Research Paper
|
Volume 12, Issue 21
|
pp. 21004–21022
Plasma tau predicts cerebral vulnerability in aging
Back to article
Figure 2
(2 of 5)
−
100%
+
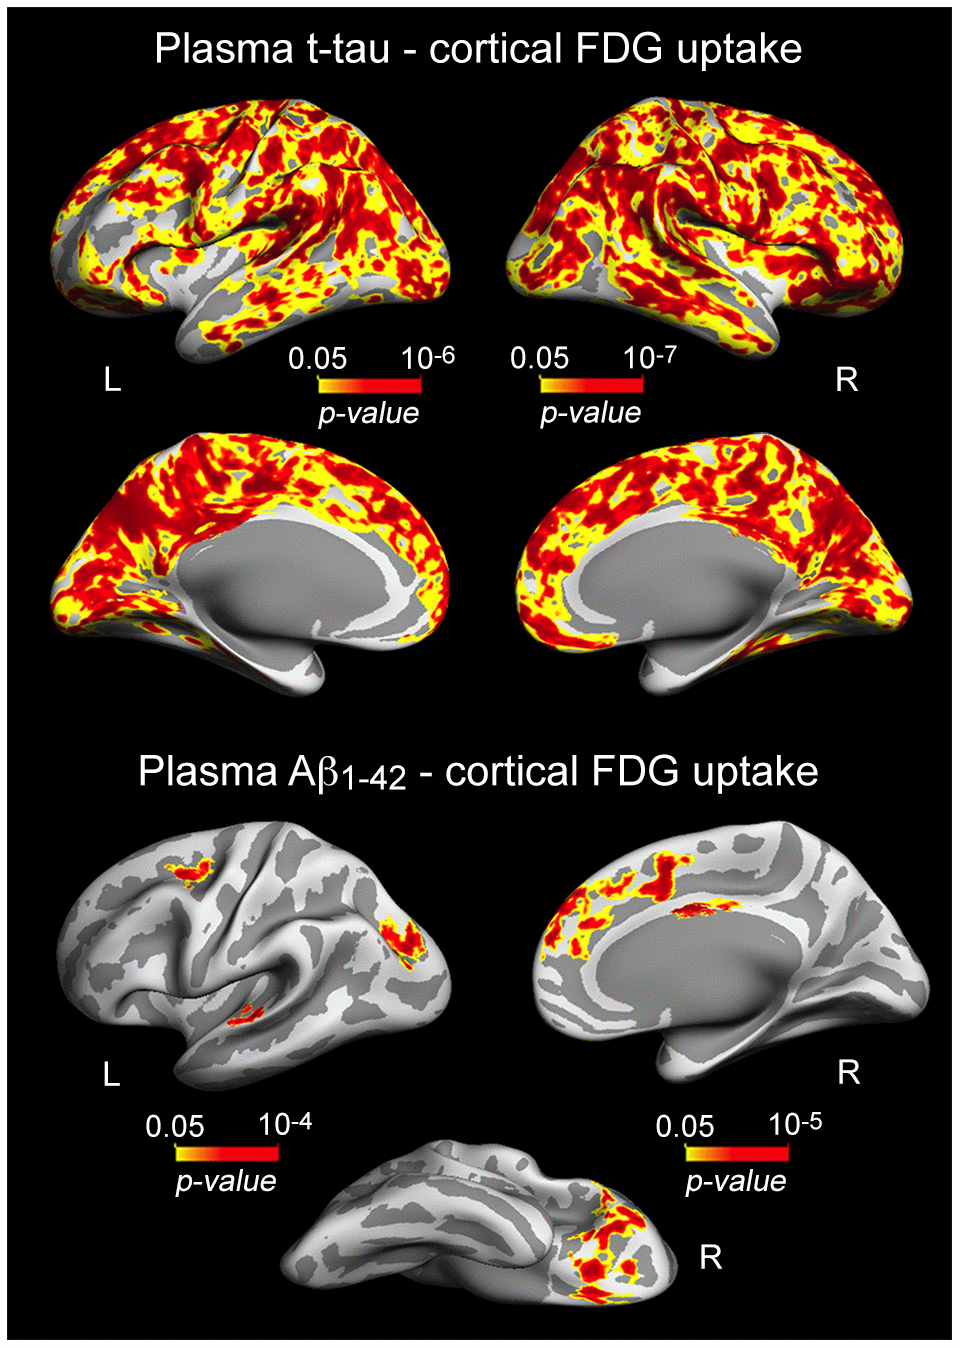
Figure 2.
Significant associations between increased plasma t-tau/Aβ
1-42
and lower cortical FDG uptake.
Results are represented on inflated cortical surfaces. Left (L) and right (R). The color scale bar illustrates the range of significant p-values.