Submit an Article
Navigate
Home
Editorial Board
Editorial Policies
Current Volume
Archive
Scientific Integrity
Publication Ethics Statements
Interviews with Outstanding Authors
Newsroom
Sponsored Conferences
Podcast
Contact
Special Collections
Submit an Article
Online ISSN: 1945-4589
Research Paper
|
Volume 12, Issue 21
|
pp. 22059–22077
Prognostic analysis of gastric signet ring cell carcinoma and mucinous carcinoma: a propensity score-matched study and competing risk analysis
Back to article
Figure 4
(4 of 8)
−
100%
+
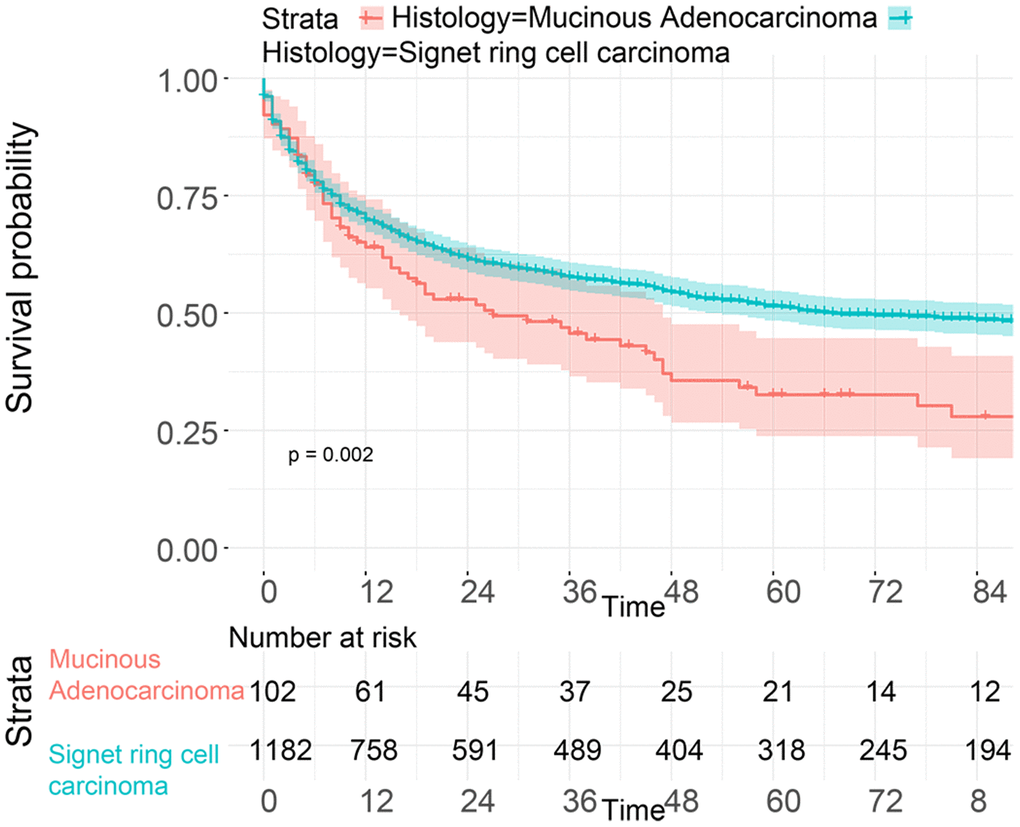
Figure 4.
OS analysis of patients from the SEER database with SRC and MGC in the early stage.