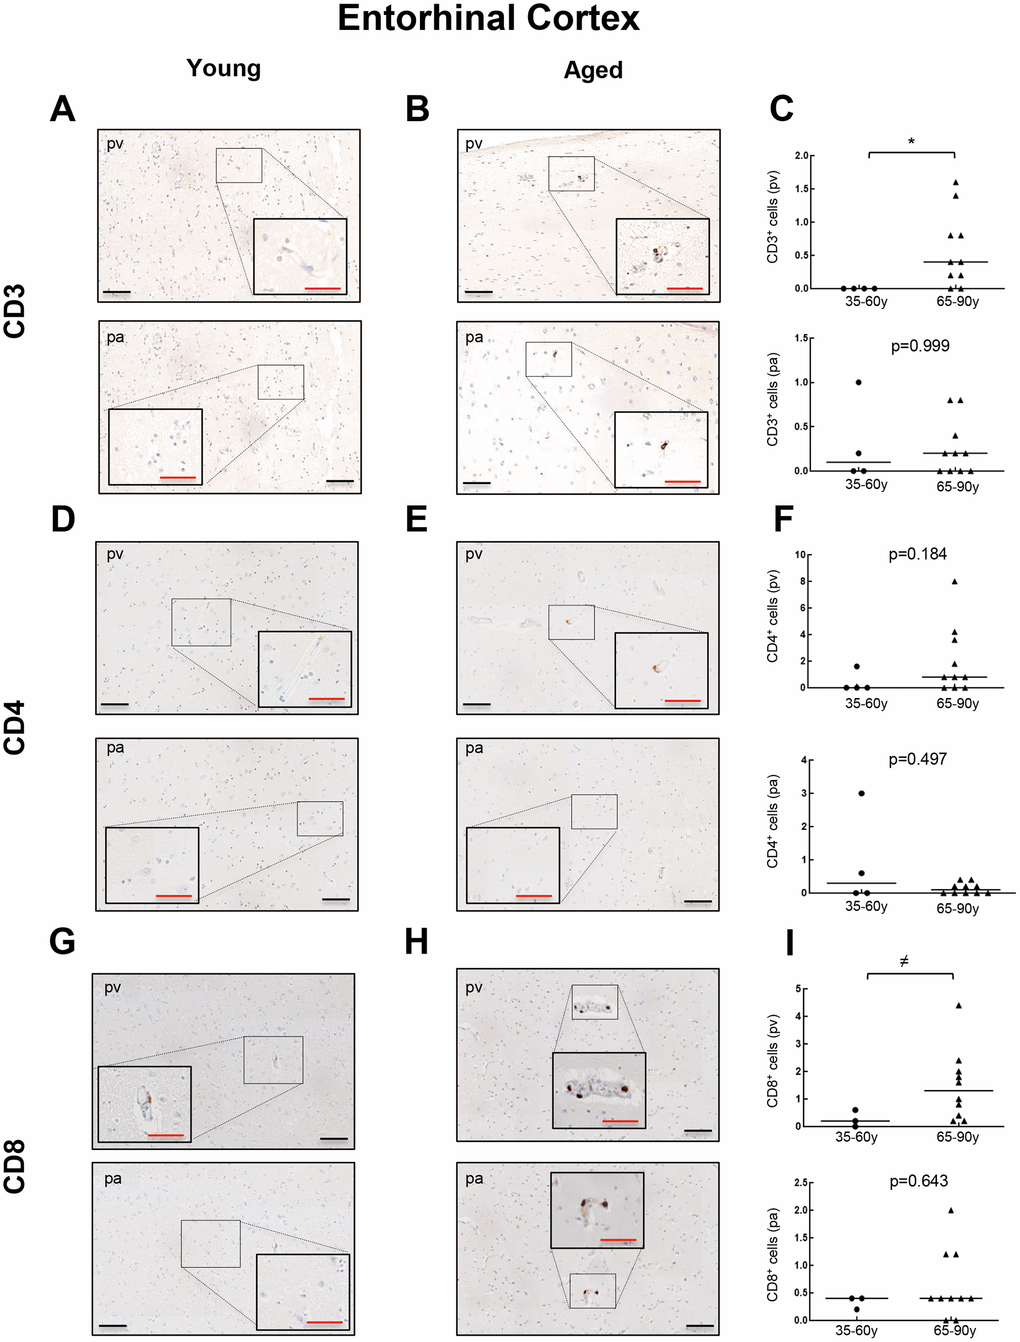
Figure 5.Comparison of CD3+, CD4+ and CD8+ cells with physiological aging in entorhinal cortex. Representative images and quantification of CD3 (A–C), CD4 (D–F) and CD8 (G–I) expression in young and aged individuals. Data are presented as number of positive cells per mm2 with median bar. Red scale bar: 50 μm; black scale bar: 100 μm. Entorhinal cortex (EC), perivascular region (pv), brain parenchyma (pa).